
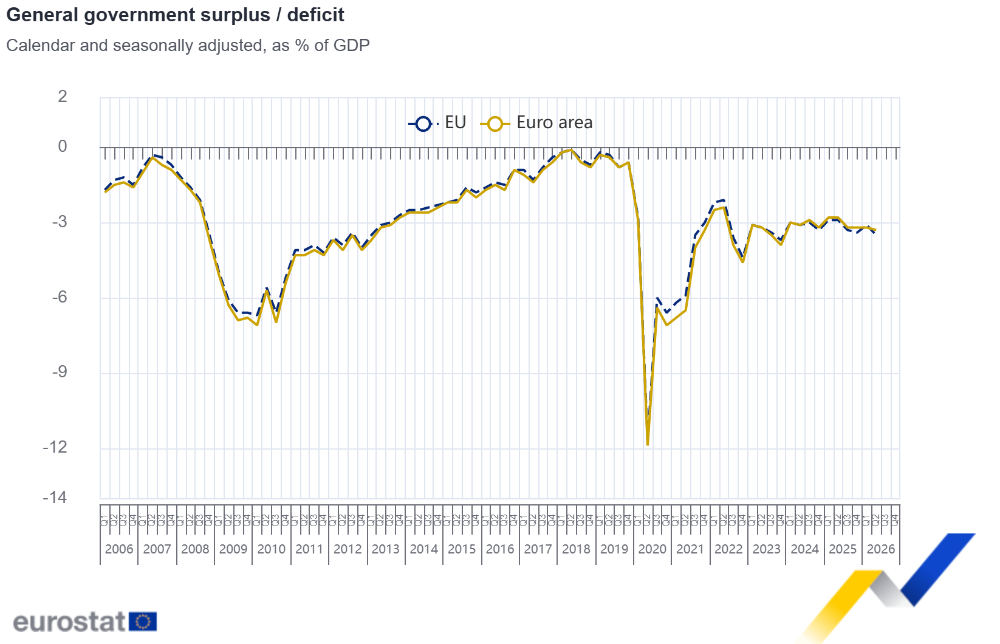
Seasonally adjusted government deficit at 3.3% of GDP in the euro area
Source: Eurostat, ec.europa.eu/eurostat. Reproduced unchanged under the Creative Commons Attribution 4.0 International licence. Original document ↗
Overview
In the second quarter of 2026, the seasonally adjusted general government deficit to GDP ratio stood at 3.3% in the euro area (EA21) and at 3.5% in the EU. The euro area deficit to GDP ratio increased slightly compared to 3.2% in the first quarter of 2026, while the EU deficit to GDP ratio increased compared to 3.1% in the previous quarter.
These data are released by Eurostat, the statistical office of the European Union.
Seasonally adjusted* general government total revenue, total expenditure and surplus (+) / deficit (-) |
|||||||||
|---|---|---|---|---|---|---|---|---|---|
2024 |
2025 |
2026 |
|||||||
(% of GDP) |
Q2 |
Q3 |
Q4 |
Q1 |
Q2 |
Q3 |
Q4 |
Q1p |
Q2p |
Euro area |
|||||||||
surplus (+) / deficit (-) |
-3.1 |
-2.9 |
-3.2 |
-2.8 |
-2.8 |
-3.2 |
-3.2 |
-3.2 |
-3.3 |
total revenue |
46.1 |
46.5 |
46.3 |
46.4 |
46.6 |
46.7 |
47.0 |
46.9 |
46.8 |
total expenditure |
49.2 |
49.4 |
49.5 |
49.2 |
49.5 |
49.9 |
50.2 |
50.0 |
50.1 |
EU |
|||||||||
surplus (+) / deficit (-) |
-3.1 |
-3.0 |
-3.3 |
-2.9 |
-2.9 |
-3.3 |
-3.4 |
-3.1 |
-3.5 |
total revenue |
45.8 |
46.1 |
45.8 |
46.0 |
46.3 |
46.3 |
46.5 |
46.4 |
46.3 |
total expenditure |
48.9 |
49.1 |
49.1 |
48.9 |
49.2 |
49.6 |
49.9 |
49.6 |
49.8 |
* calendar day and seasonally adjusted p: provisional
|
|||||||||

Seasonally adjusted government revenue and expenditure for the euro area and EU
In the second quarter of 2026, government total revenue in the euro area amounted to 46.8% of GDP. The decrease compared with 46.9% in the first quarter of 2026 was mainly due to an increase in seasonally adjusted government total revenue in absolute terms by around €21 billion being outweighed by an increase in nominal GDP. Government total expenditure in the euro area stood at 50.1% of GDP, an increase compared with the previous quarter (50.0% of GDP) due to an increase in seasonally adjusted total government expenditure by around €28 billion.
In the EU, government total revenue was 46.3% of GDP in the second quarter of 2026, with the ratio decreased compared to 46.4% in the first quarter of 2026, as an increase of seasonally adjusted total revenue in the EU by around €25 billion was outweighed by an increase in nominal GDP. Government total expenditure in the EU was 49.8% of GDP, an increase compared with 49.6% of GDP in the previous quarter. Seasonally adjusted total expenditure increased by around €42 billion compared with the previous quarter.
Tables
Seasonally adjusted* general government surplus (+) / deficit (-) |
|||||||||
|---|---|---|---|---|---|---|---|---|---|
% of GDP |
|||||||||
2024 |
2025 |
2026 |
|||||||
Q2 |
Q3 |
Q4 |
Q1 |
Q2 |
Q3 |
Q4 |
Q1p |
Q2p |
|
Euro area |
-3.1 |
-2.9 |
-3.2 |
-2.8 |
-2.8 |
-3.2 |
-3.2 |
-3.2 |
-3.3 |
EU |
-3.1 |
-3.0 |
-3.3 |
-2.9 |
-2.9 |
-3.3 |
-3.4 |
-3.1 |
-3.5 |
Belgium |
-4.5 |
-4.3 |
-5.1 |
-5.0 |
-4.9 |
-5.5 |
-5.5 |
-5.0 |
-5.3 |
Bulgaria |
-3.3 |
-6.2 |
0.5 |
-3.6 |
-3.3 |
-6.2 |
-3.2 |
-7.9 |
-5.3 |
Czechia |
-2.2 |
-2.4 |
-1.6 |
-2.2 |
-1.8 |
-2.2 |
-2.5 |
-2.6 |
-3.3 |
Denmark** |
: |
: |
: |
: |
: |
: |
: |
3.1 |
2.7 |
Germany |
-2.9 |
-2.8 |
-2.1 |
-2.1 |
-2.4 |
-3.0 |
-4.2 |
-3.8 |
-4.1 |
Estonia |
-2.5 |
-2.2 |
-0.1 |
-1.9 |
-2.7 |
-1.7 |
-1.9 |
-1.6 |
-3.2 |
Ireland |
2.4 |
12.3 |
0.8 |
1.6 |
1.5 |
1.1 |
2.6 |
2.2 |
1.9 |
Greece |
1.4 |
1.6 |
2.4 |
2.7 |
1.7 |
2.0 |
1.6 |
1.8 |
2.2 |
Spain |
-3.0 |
-3.2 |
-3.8 |
-3.1 |
-2.2 |
-2.1 |
-2.3 |
-2.2 |
-2.2 |
France |
-5.5 |
-5.9 |
-6.1 |
-5.1 |
-5.4 |
-5.4 |
-4.4 |
-5.1 |
-5.1 |
Croatia |
-3.3 |
-2.9 |
-2.1 |
-2.7 |
-2.9 |
-2.7 |
-3.5 |
-3.4 |
-4.0 |
Italy |
-3.8 |
-3.4 |
-2.9 |
-3.1 |
-2.9 |
-3.7 |
-2.5 |
-2.7 |
-3.2 |
Cyprus |
4.5 |
4.3 |
2.9 |
3.6 |
3.3 |
2.9 |
4.3 |
3.8 |
3.3 |
Latvia |
0.9 |
-2.3 |
-2.4 |
-3.1 |
-1.8 |
-4.5 |
-0.8 |
-1.5 |
-2.9 |
Lithuania |
-0.6 |
-2.4 |
-1.1 |
-1.6 |
-2.7 |
-2.0 |
-1.1 |
-0.8 |
-3.2 |
Luxembourg |
0.3 |
0.2 |
1.0 |
0.8 |
-3.3 |
-2.2 |
-2.1 |
-1.0 |
-0.2 |
Hungary |
-6.0 |
-5.2 |
-4.5 |
-4.6 |
-3.7 |
-5.2 |
-5.5 |
-6.8 |
-7.2 |
Malta |
-0.9 |
-1.7 |
-10.0 |
-0.1 |
-3.1 |
-1.6 |
-3.3 |
-3.9 |
-4.0 |
Netherlands |
-0.1 |
-0.6 |
-1.9 |
-1.6 |
-1.3 |
-1.4 |
-2.1 |
-1.9 |
-2.0 |
Austria |
-4.0 |
-5.8 |
-5.4 |
-4.6 |
-4.2 |
-4.4 |
-3.3 |
-3.3 |
-3.4 |
Poland** |
-6.1 |
-6.6 |
-7.1 |
-6.6 |
-7.3 |
-7.1 |
-7.9 |
-5.2 |
-5.9 |
Portugal |
1.4 |
1.0 |
-1.1 |
1.2 |
1.1 |
-0.2 |
0.5 |
0.7 |
0.8 |
Romania |
-7.3 |
-9.6 |
-9.9 |
-9.2 |
-7.7 |
-7.1 |
-7.3 |
-5.5 |
-9.2 |
Slovenia |
-1.7 |
-2.0 |
0.3 |
-2.4 |
-2.6 |
-1.3 |
-3.7 |
-3.3 |
-3.2 |
Slovakia |
-4.8 |
-4.6 |
-8.3 |
-3.5 |
-3.1 |
-4.1 |
-7.0 |
-3.0 |
-2.6 |
Finland** |
-4.9 |
-4.7 |
-4.6 |
-3.1 |
-3.9 |
-4.0 |
-4.2 |
-3.3 |
-3.3 |
Sweden |
-1.2 |
-2.7 |
-1.1 |
-1.4 |
-0.9 |
-1.3 |
-2.3 |
-1.1 |
-2.0 |
Iceland |
-5.1 |
-5.3 |
-3.0 |
-3.2 |
-2.0 |
-2.6 |
-2.7 |
-2.9 |
-2.7 |
* calendar and seasonally adjusted. EU and euro area data are based on national estimates. ** see country metadata notes p: provisional : confidential Source dataset: gov_10q_ggnfa
|
|||||||||
Seasonally adjusted* general government surplus (+) / deficit (-) |
||||||||
|---|---|---|---|---|---|---|---|---|
Change on the previous quarter in percentage points of GDP |
||||||||
2024 |
2025 |
2026 |
||||||
Q3 |
Q4 |
Q1 |
Q2 |
Q3 |
Q4 |
Q1p |
Q2p |
|
Euro area |
0.2 |
-0.3 |
0.4 |
-0.1 |
-0.4 |
0.1 |
0.0 |
-0.1 |
EU |
0.0 |
-0.3 |
0.4 |
0.0 |
-0.4 |
-0.1 |
0.2 |
-0.3 |
Belgium |
0.1 |
-0.8 |
0.2 |
0.1 |
-0.7 |
0.1 |
0.4 |
-0.2 |
Bulgaria |
-2.9 |
6.8 |
-4.1 |
0.3 |
-2.8 |
3.0 |
-4.7 |
2.6 |
Czechia |
-0.2 |
0.7 |
-0.5 |
0.3 |
-0.3 |
-0.3 |
-0.1 |
-0.7 |
Denmark** |
: |
: |
: |
: |
: |
: |
: |
-0.3 |
Germany |
0.0 |
0.7 |
0.0 |
-0.3 |
-0.7 |
-1.1 |
0.4 |
-0.3 |
Estonia |
0.2 |
2.1 |
-1.8 |
-0.8 |
1.1 |
-0.2 |
0.3 |
-1.6 |
Ireland |
9.9 |
-11.5 |
0.8 |
-0.1 |
-0.3 |
1.5 |
-0.4 |
-0.3 |
Greece |
0.2 |
0.8 |
0.3 |
-1.0 |
0.3 |
-0.4 |
0.2 |
0.4 |
Spain |
-0.2 |
-0.5 |
0.7 |
0.9 |
0.1 |
-0.3 |
0.1 |
0.0 |
France |
-0.5 |
-0.2 |
1.1 |
-0.4 |
0.1 |
1.0 |
-0.8 |
0.0 |
Croatia |
0.4 |
0.8 |
-0.5 |
-0.3 |
0.3 |
-0.9 |
0.1 |
-0.6 |
Italy |
0.4 |
0.5 |
-0.3 |
0.2 |
-0.8 |
1.2 |
-0.2 |
-0.5 |
Cyprus |
-0.2 |
-1.4 |
0.7 |
-0.3 |
-0.4 |
1.4 |
-0.5 |
-0.5 |
Latvia |
-3.3 |
0.0 |
-0.8 |
1.4 |
-2.7 |
3.7 |
-0.6 |
-1.4 |
Lithuania |
-1.7 |
1.3 |
-0.5 |
-1.1 |
0.7 |
0.8 |
0.3 |
-2.4 |
Luxembourg |
-0.1 |
0.8 |
-0.2 |
-4.1 |
1.1 |
0.1 |
1.1 |
0.8 |
Hungary |
0.8 |
0.7 |
-0.1 |
0.9 |
-1.5 |
-0.3 |
-1.3 |
-0.4 |
Malta |
-0.8 |
-8.4 |
9.9 |
-3.0 |
1.5 |
-1.7 |
-0.6 |
-0.1 |
Netherlands |
-0.4 |
-1.4 |
0.3 |
0.3 |
0.0 |
-0.7 |
0.1 |
-0.1 |
Austria |
-1.7 |
0.4 |
0.8 |
0.4 |
-0.3 |
1.1 |
0.1 |
-0.1 |
Poland** |
-0.5 |
-0.4 |
0.4 |
-0.6 |
0.1 |
-0.7 |
2.7 |
-0.7 |
Portugal |
-0.4 |
-2.1 |
2.4 |
-0.2 |
-1.3 |
0.7 |
0.1 |
0.1 |
Romania |
-2.3 |
-0.4 |
0.8 |
1.5 |
0.5 |
-0.2 |
1.8 |
-3.7 |
Slovenia |
-0.3 |
2.2 |
-2.7 |
-0.2 |
1.3 |
-2.4 |
0.4 |
0.1 |
Slovakia |
0.2 |
-3.6 |
4.8 |
0.3 |
-1.0 |
-2.9 |
3.9 |
0.5 |
Finland** |
0.2 |
0.1 |
1.4 |
-0.8 |
-0.1 |
-0.2 |
0.9 |
0.0 |
Sweden |
-1.4 |
1.5 |
-0.2 |
0.5 |
-0.4 |
-1.0 |
1.2 |
-0.9 |
Iceland |
-0.2 |
2.3 |
-0.3 |
1.2 |
-0.6 |
-0.1 |
-0.1 |
0.2 |
* calendar and seasonally adjusted. EU and euro area data are based on national estimates. ** see country metadata notes p: provisional : confidential Source dataset: gov_10q_ggnfa
|
||||||||
Non-seasonally adjusted general government surplus (+) / deficit (-) |
|||||||||
|---|---|---|---|---|---|---|---|---|---|
% of GDP |
|||||||||
2024 |
2025 |
2026 |
|||||||
Q2 |
Q3 |
Q4 |
Q1 |
Q2 |
Q3 |
Q4 |
Q1p |
Q2p |
|
Euro area |
-2.9 |
-2.6 |
-2.6 |
-3.9 |
-2.7 |
-3.0 |
-2.5 |
-4.3 |
-3.3 |
EU |
-2.7 |
-2.7 |
-3.2 |
-3.8 |
-2.6 |
-3.0 |
-3.2 |
-4.0 |
-3.2 |
Belgium |
-0.1 |
-7.4 |
-1.9 |
-9.6 |
-0.7 |
-8.7 |
-2.4 |
-9.9 |
-0.9 |
Bulgaria |
-1.4 |
-3.5 |
-3.2 |
-3.8 |
-1.1 |
-3.4 |
-7.1 |
-8.4 |
-3.1 |
Czechia |
0.3 |
-1.5 |
-3.6 |
-3.6 |
0.4 |
-1.1 |
-4.5 |
-3.6 |
-1.5 |
Denmark* |
: |
: |
: |
: |
: |
: |
: |
3.0 |
4.4 |
Germany |
-1.8 |
-3.3 |
-2.9 |
-1.8 |
-1.2 |
-3.5 |
-5.1 |
-3.4 |
-2.8 |
Estonia |
-1.5 |
-1.2 |
0.5 |
-4.3 |
-2.0 |
-0.6 |
-1.4 |
-3.9 |
-2.7 |
Ireland |
2.4 |
10.9 |
3.3 |
0.3 |
1.4 |
-0.3 |
5.8 |
0.7 |
1.9 |
Greece |
4.2 |
4.6 |
2.0 |
-1.3 |
3.1 |
6.0 |
-0.6 |
-2.4 |
4.8 |
Spain |
-6.6 |
2.7 |
-7.1 |
-1.7 |
-6.6 |
3.5 |
-4.6 |
-1.5 |
-7.2 |
France |
-6.6 |
-7.3 |
-2.8 |
-6.1 |
-6.3 |
-6.7 |
-1.4 |
-5.8 |
-6.7 |
Croatia |
-3.3 |
2.3 |
-7.5 |
-3.3 |
-3.6 |
2.6 |
-8.6 |
-3.8 |
-4.9 |
Italy |
-2.8 |
-3.4 |
1.5 |
-9.4 |
-2.1 |
-4.2 |
2.7 |
-8.9 |
-2.0 |
Cyprus |
0.1 |
9.7 |
-0.8 |
6.4 |
-1.3 |
7.1 |
2.0 |
6.9 |
-1.4 |
Latvia |
4.6 |
-0.6 |
-9.0 |
-0.8 |
1.9 |
-3.3 |
-7.0 |
1.1 |
0.8 |
Lithuania |
2.4 |
-1.0 |
-5.3 |
-1.2 |
0.2 |
-0.6 |
-5.2 |
-0.3 |
-0.6 |
Luxembourg |
3.8 |
-0.6 |
-3.8 |
3.1 |
0.5 |
-3.1 |
-6.8 |
1.3 |
3.6 |
Hungary |
-2.4 |
-3.9 |
-7.7 |
-7.1 |
0.3 |
-4.2 |
-8.0 |
-10.4 |
-3.3 |
Malta |
0.5 |
0.3 |
-12.3 |
-1.4 |
-3.8 |
0.5 |
-3.5 |
-5.7 |
-5.3 |
Netherlands |
0.2 |
-1.3 |
-2.8 |
-0.6 |
-1.0 |
-1.7 |
-3.1 |
-0.9 |
-1.7 |
Austria |
-3.6 |
-4.3 |
-4.8 |
-7.2 |
-3.7 |
-3.1 |
-2.7 |
-5.8 |
-2.8 |
Poland* |
-7.1 |
-5.9 |
-11.4 |
-2.1 |
-8.3 |
-6.3 |
-11.4 |
-1.2 |
-7.2 |
Portugal |
1.8 |
5.7 |
-4.9 |
0.0 |
1.7 |
4.1 |
-3.1 |
-0.7 |
1.6 |
Romania |
-5.2 |
-7.7 |
-11.4 |
-11.8 |
-5.7 |
-5.3 |
-8.9 |
-7.4 |
-7.8 |
Slovenia |
-2.3 |
-0.7 |
0.1 |
-3.1 |
-3.3 |
0.0 |
-3.9 |
-4.0 |
-3.9 |
Slovakia |
-4.0 |
-3.0 |
-11.5 |
-2.3 |
-2.3 |
-2.5 |
-10.1 |
-1.9 |
-1.8 |
Finland* |
-2.6 |
-7.7 |
-5.1 |
-1.6 |
-1.7 |
-6.5 |
-5.3 |
-2.4 |
-0.7 |
Sweden |
1.3 |
-2.0 |
-3.7 |
-2.1 |
1.6 |
-0.6 |
-5.0 |
-1.6 |
0.4 |
Iceland |
-6.2 |
-4.9 |
-3.9 |
-1.5 |
-3.0 |
-2.3 |
-3.7 |
-1.3 |
-3.8 |
Norway |
15.2 |
12.2 |
9.9 |
16.9 |
13.0 |
9.4 |
2.7 |
13.1 |
15.0 |
Switzerland |
0.2 |
-0.1 |
-0.2 |
1.0 |
0.4 |
-0.2 |
-0.3 |
1.1 |
1.2 |
* see country metadata notes p: provisional Source dataset: gov_10q_ggnfa
|
|||||||||
Non-seasonally adjusted general government surplus (+) / deficit (-) |
|||||
|---|---|---|---|---|---|
Change on the previous year's quarter in percentage points of GDP |
|||||
2025 |
2026 |
||||
Q2 |
Q3 |
Q4 |
Q1p |
Q2p |
|
Euro area |
0.2 |
-0.4 |
0.1 |
-0.4 |
-0.6 |
EU |
0.1 |
-0.3 |
0.0 |
-0.2 |
-0.6 |
Belgium |
-0.7 |
-1.3 |
-0.5 |
-0.3 |
-0.2 |
Bulgaria |
0.3 |
0.1 |
-3.9 |
-4.5 |
-2.1 |
Czechia |
0.2 |
0.3 |
-0.9 |
0.0 |
-1.9 |
Denmark* |
: |
: |
: |
: |
: |
Germany |
0.6 |
-0.2 |
-2.2 |
-1.6 |
-1.7 |
Estonia |
-0.5 |
0.6 |
-1.8 |
0.4 |
-0.7 |
Ireland |
-0.9 |
-11.2 |
2.5 |
0.4 |
0.4 |
Greece |
-1.1 |
1.4 |
-2.5 |
-1.2 |
1.7 |
Spain |
0.0 |
0.8 |
2.5 |
0.2 |
-0.5 |
France |
0.4 |
0.6 |
1.5 |
0.3 |
-0.4 |
Croatia |
-0.3 |
0.3 |
-1.1 |
-0.6 |
-1.3 |
Italy |
0.7 |
-0.8 |
1.1 |
0.5 |
0.1 |
Cyprus |
-1.5 |
-2.5 |
2.8 |
0.4 |
-0.1 |
Latvia |
-2.7 |
-2.7 |
2.0 |
1.8 |
-1.1 |
Lithuania |
-2.1 |
0.3 |
0.1 |
0.9 |
-0.8 |
Luxembourg |
-3.3 |
-2.6 |
-2.9 |
-1.8 |
3.1 |
Hungary |
2.6 |
-0.3 |
-0.3 |
-3.3 |
-3.6 |
Malta |
-4.4 |
0.1 |
8.8 |
-4.4 |
-1.4 |
Netherlands |
-1.2 |
-0.4 |
-0.3 |
-0.4 |
-0.7 |
Austria |
-0.1 |
1.2 |
2.1 |
1.4 |
0.9 |
Poland* |
-1.2 |
-0.4 |
0.1 |
0.9 |
1.1 |
Portugal |
-0.1 |
-1.5 |
1.8 |
-0.7 |
0.0 |
Romania |
-0.5 |
2.3 |
2.5 |
4.3 |
-2.1 |
Slovenia |
-1.0 |
0.7 |
-4.0 |
-0.9 |
-0.5 |
Slovakia |
1.7 |
0.5 |
1.3 |
0.5 |
0.5 |
Finland* |
1.0 |
1.2 |
-0.2 |
-0.8 |
0.9 |
Sweden |
0.3 |
1.4 |
-1.3 |
0.5 |
-1.2 |
Iceland |
3.2 |
2.5 |
0.2 |
0.2 |
-0.8 |
Norway |
-2.2 |
-2.8 |
-7.2 |
-3.8 |
2.0 |
Switzerland |
0.1 |
-0.1 |
0.0 |
0.1 |
0.8 |
* see country metadata notes p: provisional Source dataset: gov_10q_ggnfa
|
|||||
Notes for users
Methods and definitions
Data for the euro area and EU aggregates are calendar and seasonally adjusted by Eurostat using an indirect approach (by country) for total revenue and total expenditure. Both revenue and expenditure exhibit a clear seasonal pattern. The surplus (+) / deficit (-) is derived indirectly from the above-mentioned transactions. For the ratios to GDP, calendar and seasonally adjusted GDP data are used.
Detailed metadata on seasonal adjustment are available in Statistics Explained.
Quarterly non-financial accounts for general government use concepts that are in line with the methodology laid out in the European System of Accounts (ESA 2010) as well as the concept of general government deficit/surplus used in the context of the Excessive Deficit Procedure (EDP). Annual EDP data, next to be published in October 2026, are the subject of a thorough verification by Eurostat.
Quarterly data on GDP are the most recent ones provided by EU Member States. While non-seasonally adjusted quarterly government deficit/surplus figures are consistent with annual figures with the exception of differences due to data updates, differences between the sum of quarterly non-seasonally adjusted data and annual figures may occur for EU and euro area aggregates due to exchange rates effects. Differences between annualised seasonally adjusted data and annual data occur for technical reasons. Differences between quarterly and annual GDP figures also occur, due to differences in data updates.
At the level of the EU aggregates, differences between the change in total revenue and total expenditure and the change in surplus (+) / deficit (-) are due to rounding, as are differences between data in percentage of GDP and changes in data in percentage points of GDP.
Since the first quarter of 2020, Member States have implemented COVID-19 containment measures. In all quarters of 2022 and 2023, the impact of the measures to mitigate the economic and social impact of the COVID-19 pandemic had a significantly lower impact than in quarters of 2020 and 2021, however, government revenue and expenditure were impacted by the measures undertaken by most Member States to alleviate the impact of increasing energy prices. In the quarters of 2024, 2025 and 2026, such measures have a much lower impact than in preceding quarters.
All quarterly government finance statistics data for the first and second quarters of 2026 have been labelled provisional.
Country specific explanatory metadata are published.
Geographical information
Euro area (EA21): Belgium, Bulgaria, Germany, Estonia, Ireland, Greece, Spain, France, Croatia, Italy, Cyprus, Latvia, Lithuania, Luxembourg, Malta, the Netherlands, Austria, Portugal, Slovenia, Slovakia and Finland.
The European Union (EU27) includes Belgium, Bulgaria, Czechia, Denmark, Germany, Estonia, Ireland, Greece, Spain, France, Croatia, Italy, Cyprus, Latvia, Lithuania, Luxembourg, Hungary, Malta, the Netherlands, Austria, Poland, Portugal, Romania, Slovenia, Slovakia, Finland and Sweden.
For more information
Further data are available in the “Presentation on integrated government finance statistics”
Source: Eurostat, ec.europa.eu/eurostat. Original document ↗