
Trade report, 2 October 2026: two baskets, one held over the weekend
Two SP500 + NDX baskets after the US jobs report: basket 1 closed after 27 minutes (NDX +67.9, SP500 +4.7 points); basket 2 was held over the weekend and closed on 5 October, NDX −5.9 points first, SP500 +10.0.
Platform time UTC+3. Every entry, exit and result comes from the trading account's closed-position history. Returns for XFX investors are produced by Darwinex's risk engine and differ from these numbers — see the section on XFX investors below.
The trades, on the charts
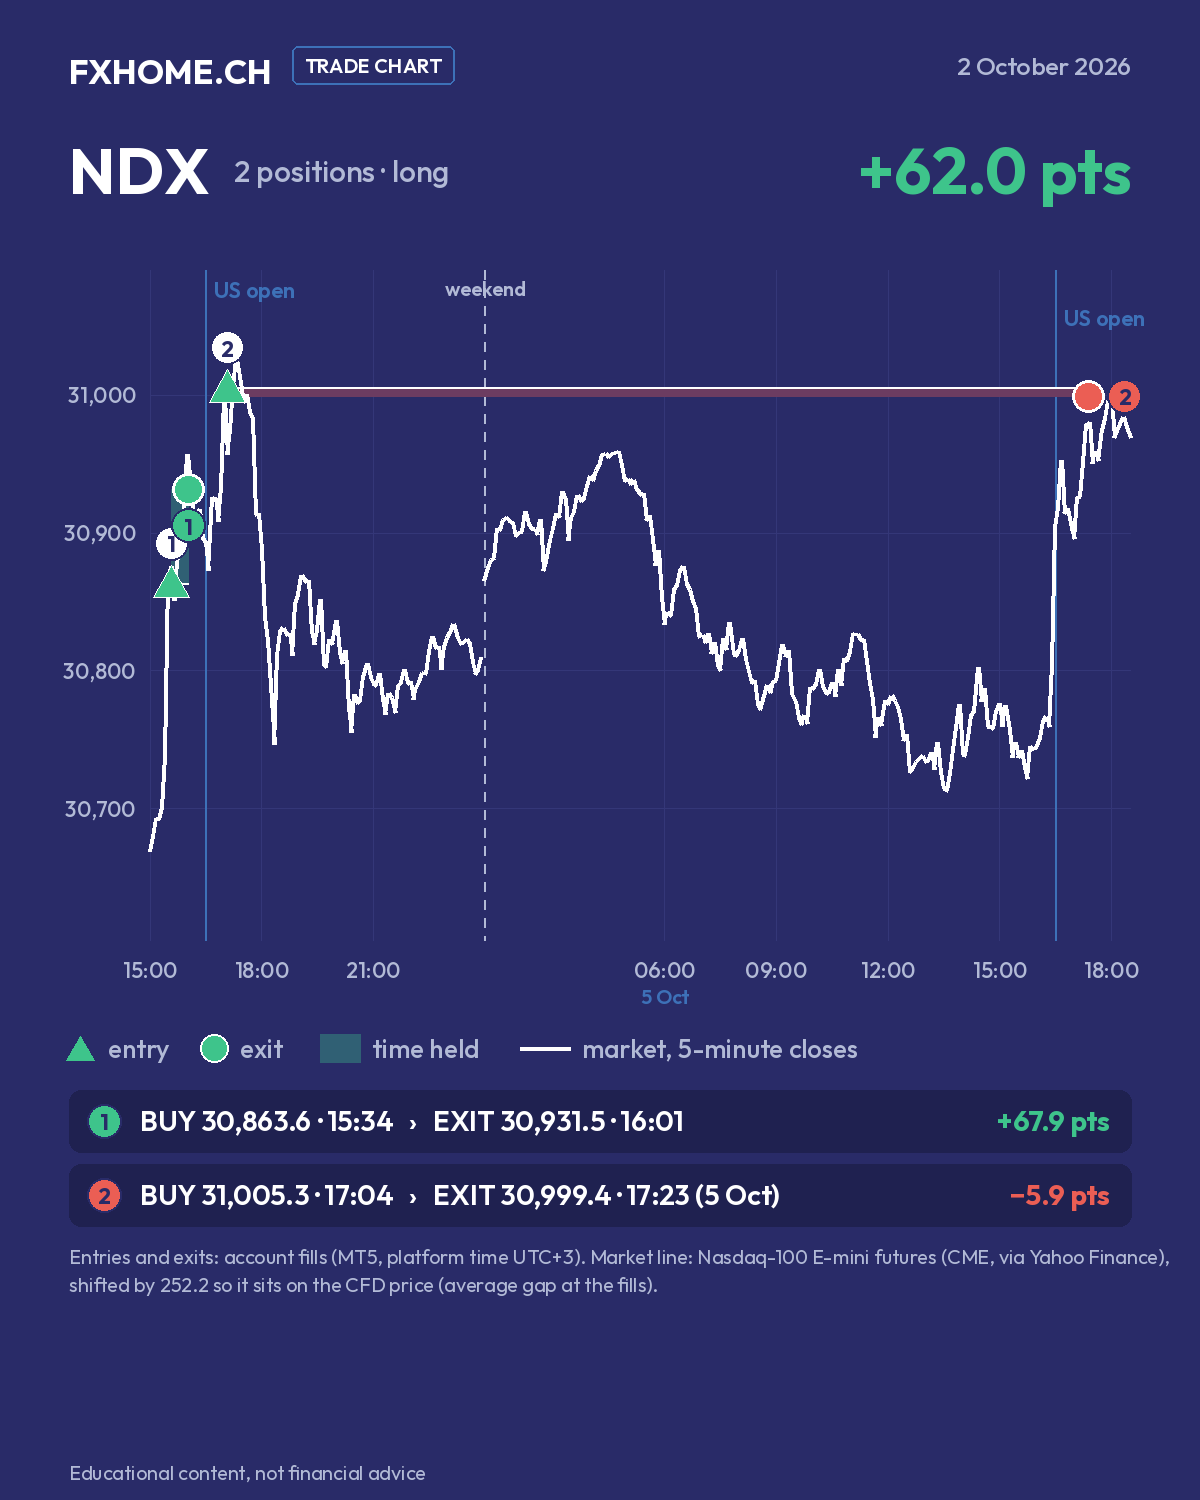
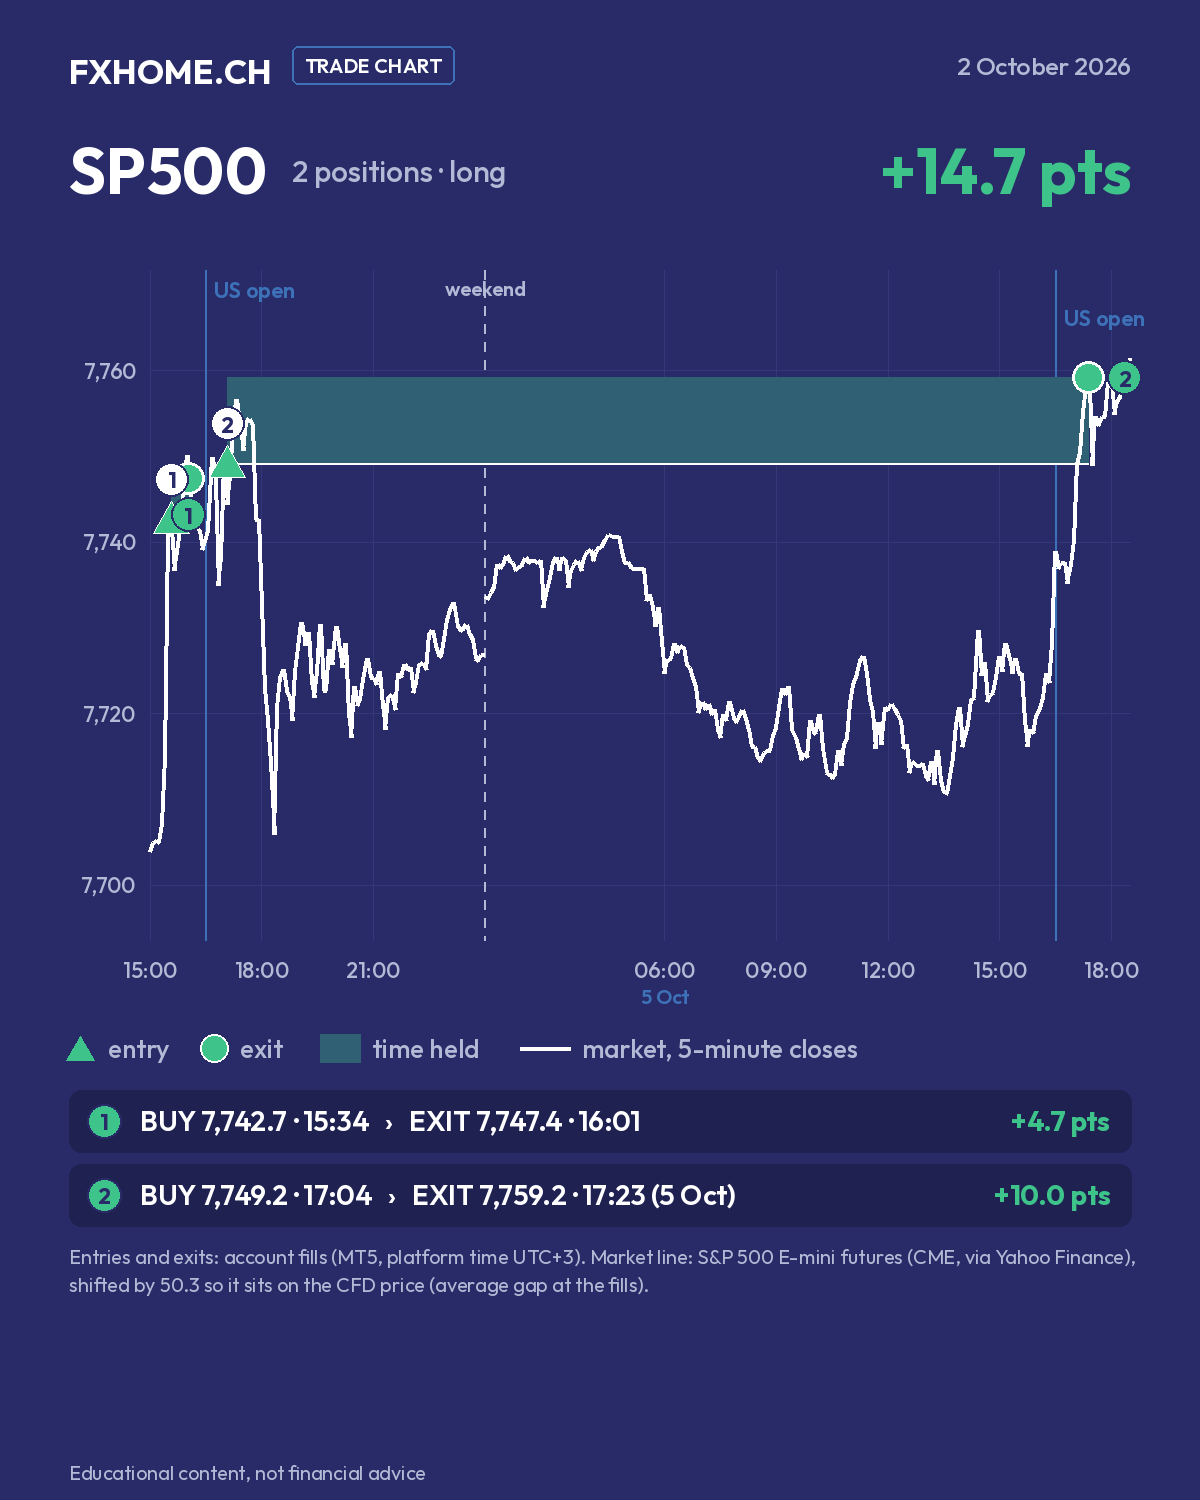
Four long positions in two index baskets, both opened on Friday 2 October after the US jobs report. Basket 1 (SP500 and NDX) was closed after 27 minutes; basket 2 (SP500 and NDX again) was held over the weekend and closed on Monday 5 October. One chart per instrument, the one with the loss first. The green triangle is an entry, the dot the exit (green closed up, red closed down), the shaded band the time the position was held, and the numbers match the list under each chart. The dashed line marks the weekend, when the futures do not trade; it is cut out of the time axis.
| # | What | Entry | Exit | Result |
|---|---|---|---|---|
| NDX 1 | ▲ long basket 1 |
30,863.6 15:34 |
30,931.5 16:01 |
+67.9 pts |
| SP500 1 | ▲ long basket 1 |
7,742.7 15:34 |
7,747.4 16:01 |
+4.7 pts |
| NDX 2 | ▲ long basket 2 |
31,005.3 17:04 |
30,999.4 5 Oct 17:23 |
−5.9 pts |
| SP500 2 | ▲ long basket 2 |
7,749.2 17:04 |
7,759.2 5 Oct 17:23 |
+10.0 pts |
▲ long (bought) · basket 2 held over the weekend
The loss, first
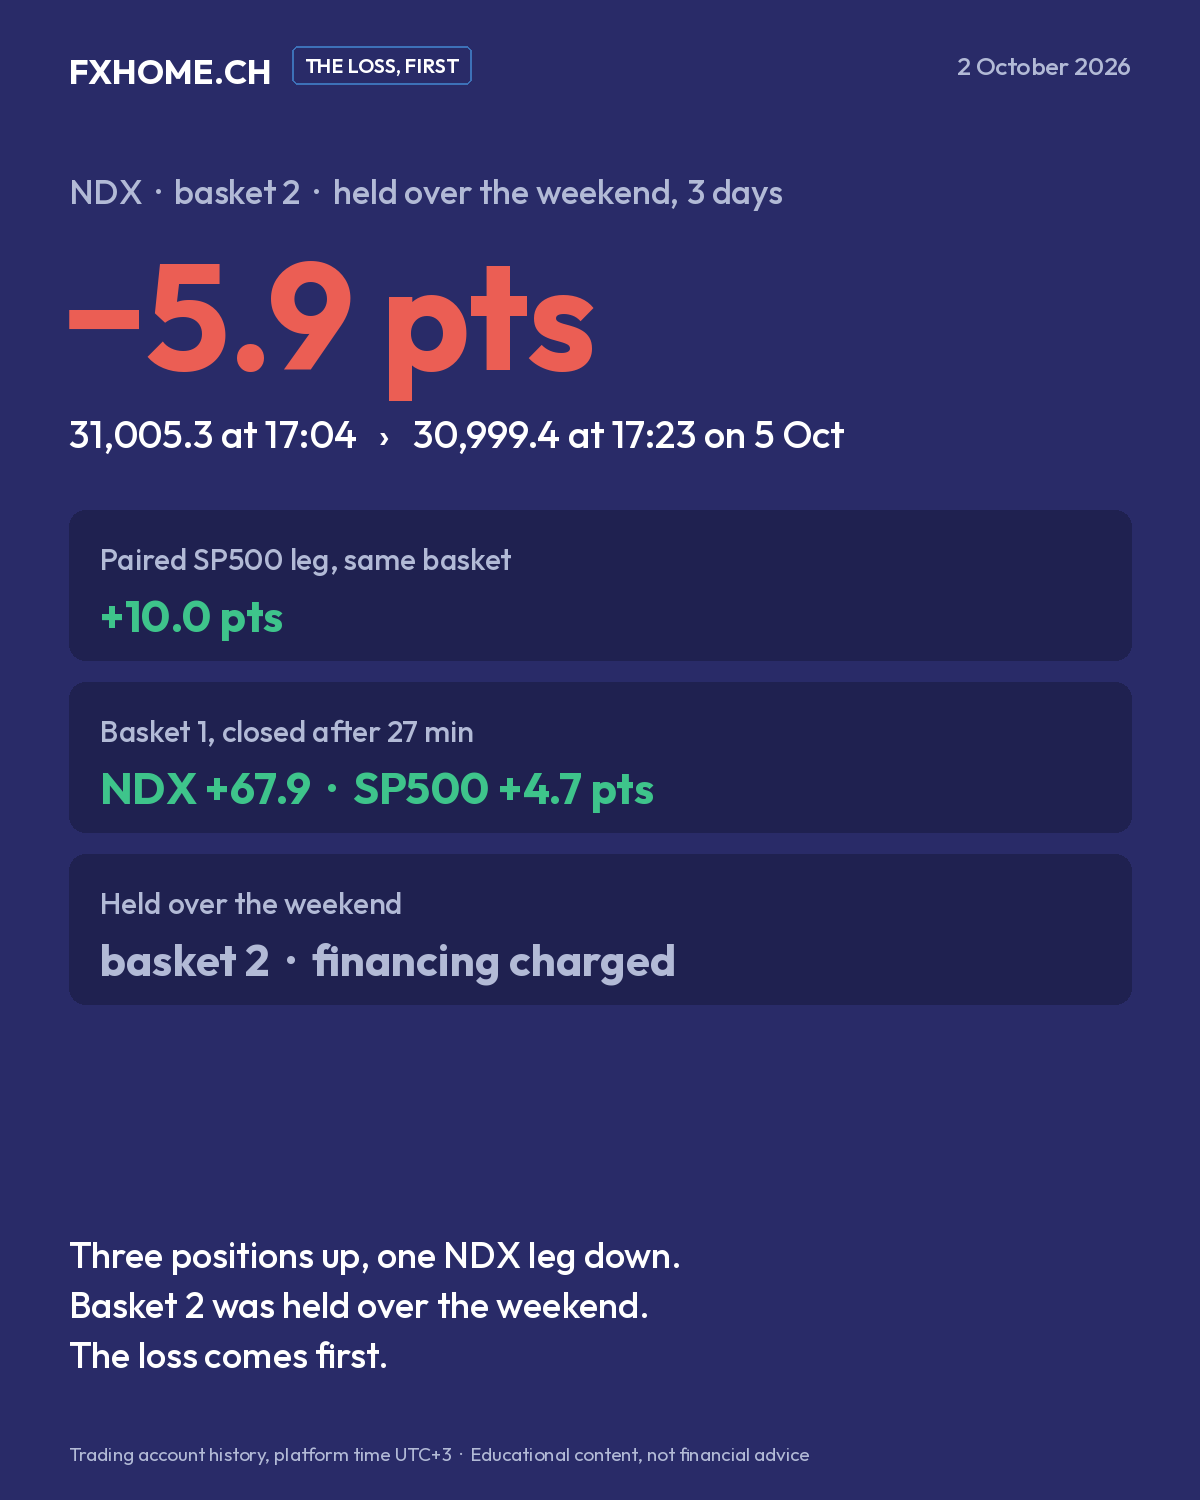
The only loser was the NDX leg of basket 2: bought at 31,005.3 at 17:04 on Friday and closed at 30,999.4 at 17:23 on Monday 5 October — −5.9 points after 3 days and 19 minutes. Its SP500 twin, bought eight seconds later at 7,749.2, closed at 7,759.2 four seconds earlier — +10.0 points.
What the record and the charts show: both positions of basket 2 were bought close to the high of Friday afternoon. Within an hour both indices had fallen well below the entries — on the reference lines about 260 NDX points and about 45 SP500 points under them around 18:00 — and they closed the week there. On Monday morning they were still below, made another low around 13:30, and rose sharply after the US open at 16:30. The basket was closed at 17:23, with SP500 above its entry and NDX just under its own. Holding over the weekend also cost three nights of financing, which is why costs were much higher than on an intraday day (see below).
What happened, in order
- 15:30 — US jobs report for September. On the charts both index futures jumped in the 15:30 bar. (At 15:33 the basket opened on 1 October was closed — see that report.)
- 15:34 — basket 1: bought NDX at 30,863.6 and SP500 at 7,742.7, 26 seconds apart.
- 16:01 — basket 1 closed: NDX at 30,931.5 (+67.9 points) and SP500 at 7,747.4 (+4.7 points), after 27 minutes.
- 16:30 — US open. Both indices kept rising for about half an hour.
- 17:04 — basket 2: bought NDX at 31,005.3 and SP500 at 7,749.2.
- 17:30–18:00 — sharp fall on both charts, to the lows of the afternoon; the indices recovered only part of it before the close.
- Weekend — basket 2 held (no trading in the futures from Friday night to Sunday night).
- Monday 5 October, morning — still below the entries; low of the morning around 13:30.
- 16:30 — US open, rally on both charts.
- 17:23 — basket 2 closed: SP500 at 7,759.2 (+10.0 points), NDX at 30,999.4 (−5.9 points).
Basket 1 paired SP500 and NDX at 1.0 : 0.2 lots; basket 2 at 1.5 : 0.5.
Market context
The September jobs report, released at 15:30 platform time, showed US employers added only 29,000 jobs, well below forecasts (about 84,000–90,000, depending on the survey), and the unemployment rate rose to 4.2 %. Traders reduced bets on a Federal Reserve rate increase, and stocks rose: the S&P 500 closed at 7,722.72 (+0.7 %), within 1 % of its all-time high, the Nasdaq Composite at 27,190.86 (+1.2 %) and the Dow at 51,176.96 (+0.5 %). Treasury yields first fell sharply after the report, then gave back most of the move as oil recovered from an early drop. For the week the S&P 500 lost 0.3 % and the Dow 1.3 %, while the Nasdaq gained 0.5 %. Sources at the end.
Costs of the day
Commission on all four positions, plus overnight financing on basket 2 for the weekend; no dividend adjustments. Costs took 43.6 % of the day's gross trading result — financing on the weekend basket was about 21 times the commission on all four positions. That is the cost of holding over a weekend, and it is part of the record, so it is part of the report.
What XFX investors saw
DARWIN XFX replicates this account's positions through Darwinex's risk engine, which targets a monthly value-at-risk of 6.5 % (95 %) and scales position sizes accordingly. An investor's result for these days is therefore the change in the DARWIN's quote, published on the XFX page at Darwinex, not the figures above. That is also why these reports are written in points, not currency: points describe the trading; the DARWIN's quote describes the investment.
About the charts
Entry and exit prices and times are the account's real fills. The market lines are public reference series at 5-minute closes, via Yahoo Finance: the Nasdaq-100 E-mini futures (shifted down by 252.2 points) and the S&P 500 E-mini futures (shifted down by 50.3 points). Each shift is the average gap between the reference series and the account's CFD price at that instrument's fills, so that the line sits on the same price scale as the fills. The charts show 15:00 on 2 October to 18:30 on 5 October; the weekend, from the futures' Friday close (00:00 platform time) to their reopening on Monday 5 October (01:10), is cut out of the time axis and marked with a dashed line. The shape of the days is the market's; the levels of the fills are the account's.
Sources
- AP via LA NACION – How major US stock indexes fared Friday 10/2/2026 (S&P 500 7,722.72 +0.7 %, Dow 51,176.96 +0.5 %, Nasdaq 27,190.86 +1.2 %; weekly −0.3 %, −1.3 %, +0.5 %; hiring slowed, fewer rate-hike bets, yields fell then gave back most of the drop): https://www.lanacion.com.ar/usa/how-major-us-stock-indexes-fared-friday-1022026-nid02102026/
- Stocktwits – S&P 500, Nasdaq, Dow End Week Higher As Weak Jobs Report Cools Rate Hike Bets (payrolls +29,000 vs 84,000 expected; unemployment 4.2 %): https://stocktwits.com/news-articles/markets/equity/s-and-p-500-nasdaq-dow-end-week-higher-as-weak-jobs-report-cools-rate-hike-bets-nvda-ba-spcx-rivn-apld-in-focus/cZDjq3URBKF
- investingLive – US September non-farm payrolls +29K vs +90K expected: https://investinglive.com/news/us-september-non-farm-payrolls-29k-vs-90k-expected/
- Yahoo Finance – 5-minute chart data, 2–5 October 2026 (market lines of the charts): E-mini Nasdaq-100 https://finance.yahoo.com/quote/NQ=F/ · E-mini S&P 500 https://finance.yahoo.com/quote/ES=F/
- Darwinex – DARWIN XFX (VaR target): https://www.darwinex.com/invest/XFX
- Trading account history (MetaTrader 5): closed positions opened on 2 October 2026