
Trade report, 13 October 2026: two baskets, both up
Four long positions in two SP500 and NDX baskets, all closed up: NDX +50.4 and +73.3 points, SP500 +9.6 and +1.2 points. No loss; the smallest result first, with entry and exit charts.
Platform time UTC+3. Every entry, exit and result comes from the trading account's closed-position history. Returns for XFX investors are produced by Darwinex's risk engine and differ from these numbers — see the last section.
The trades, on the charts
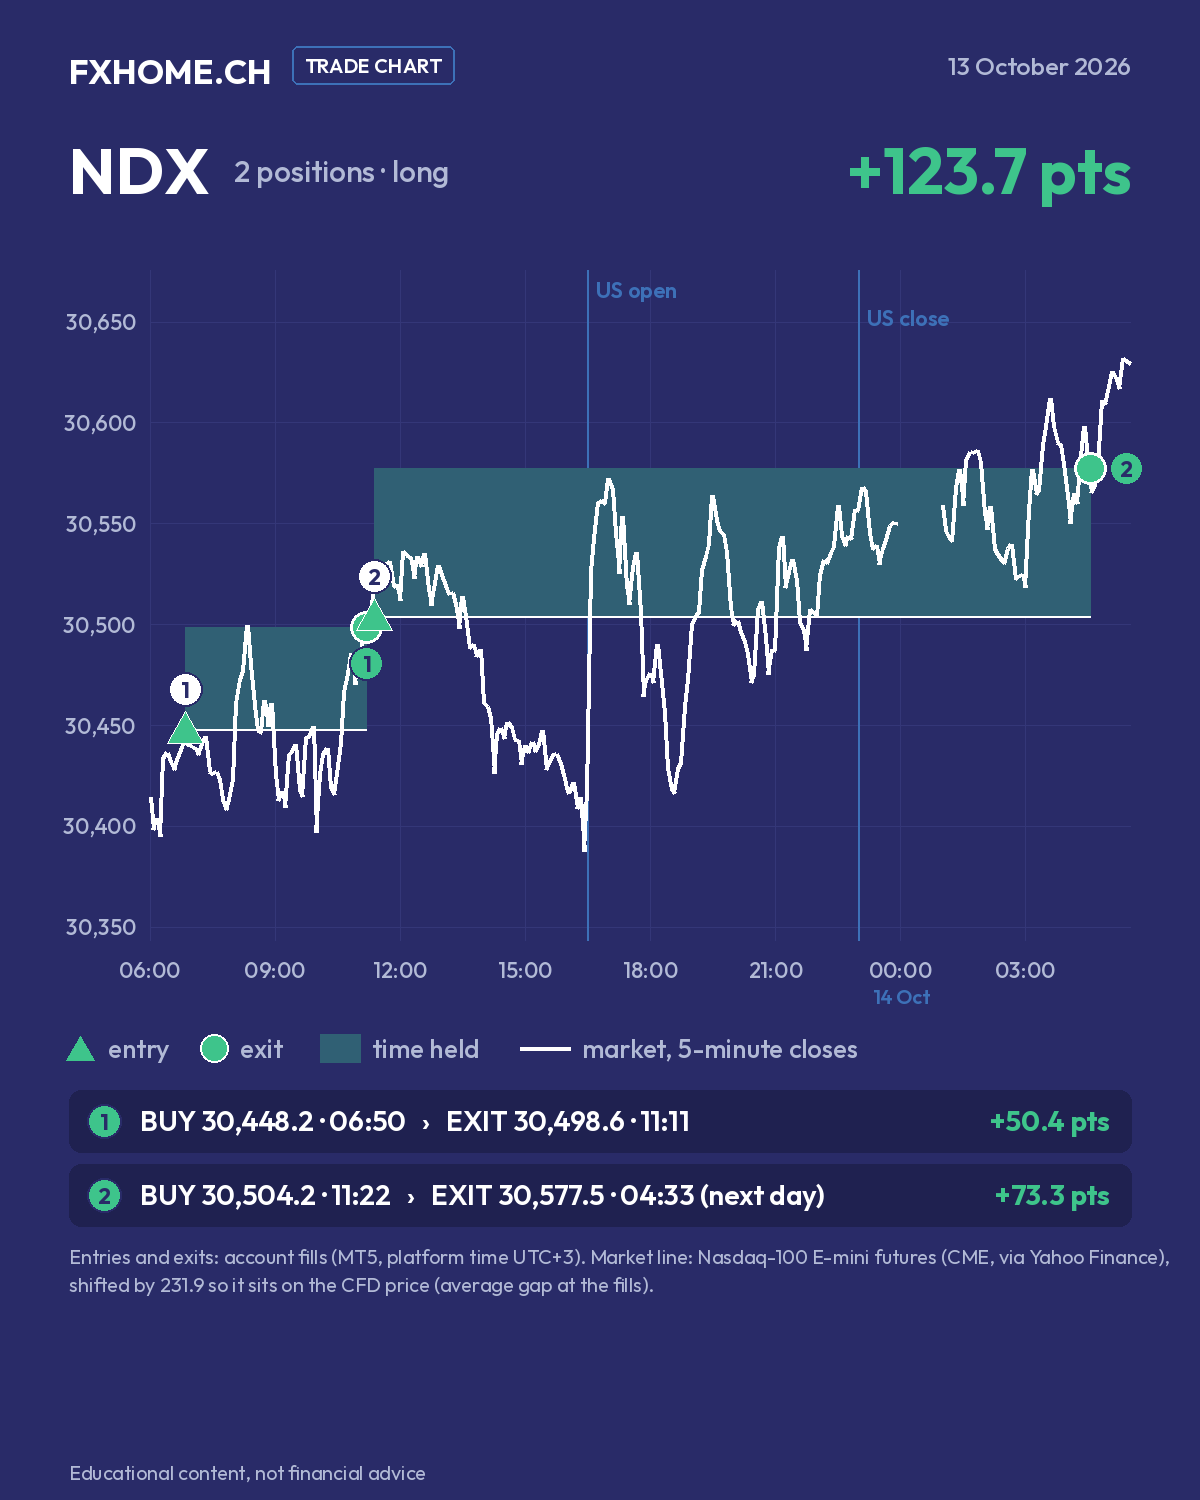
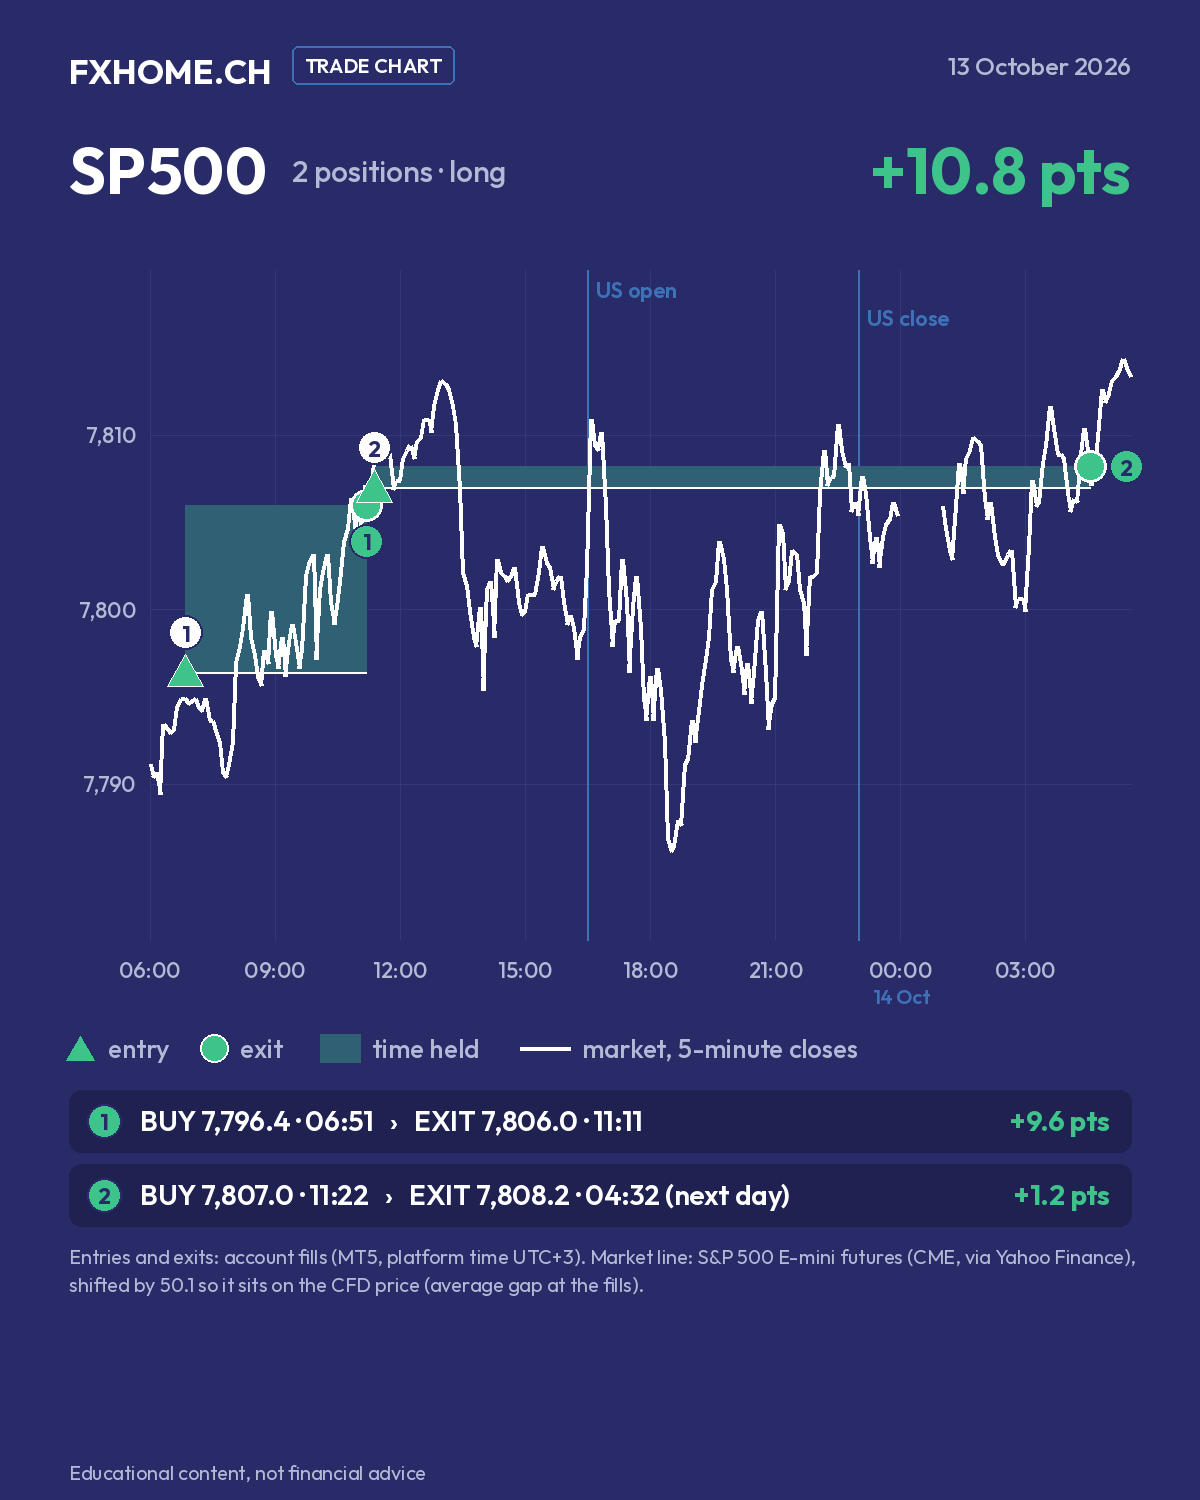
Four long positions in two baskets, each basket one SP500 and one NDX position opened and closed together. One chart per instrument. The green triangle is an entry, the green dot the exit (closed up), the shaded band the time the position was held, and the numbers match the list under each chart.
| # | What | Entry | Exit | Result |
|---|---|---|---|---|
| NDX 1 | ▲ long basket 1 |
30,448.2 06:50 |
30,498.6 11:11 |
+50.4 pts |
| SP500 1 | ▲ long basket 1 |
7,796.4 06:51 |
7,806.0 11:11 |
+9.6 pts |
| NDX 2 | ▲ long ☾ basket 2 |
30,504.2 11:22 |
30,577.5 04:33 |
+73.3 pts |
| SP500 2 | ▲ long ☾ basket 2 |
7,807.0 11:22 |
7,808.2 04:32 |
+1.2 pts |
▲ long (bought) · ☾ held overnight, closed on 14 October
The loss, first
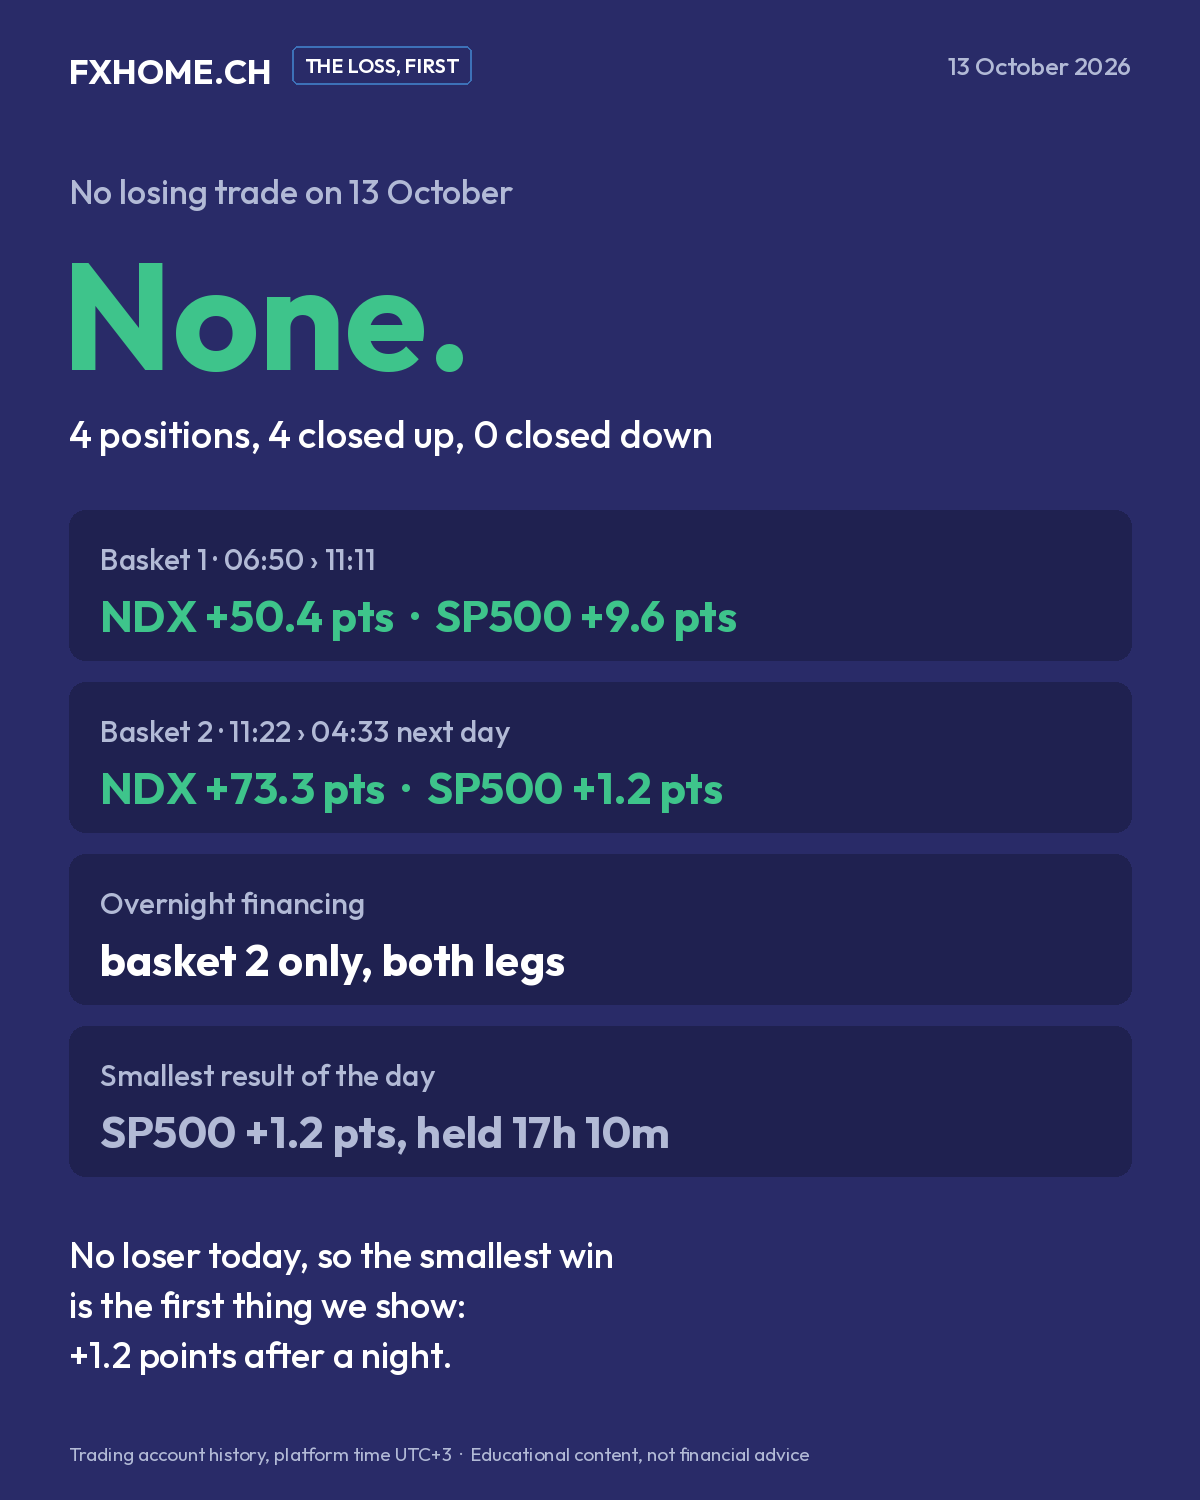
None on 13 October: four positions, four closed up. With no loser to show, the smallest result goes first: the SP500 leg of basket 2, bought at 7,807.0 at 11:22 and closed at 7,808.2 at 04:32 the next morning — +1.2 points after 17 h 10 min, with a night of financing charged against it. Its NDX twin in the same basket closed +73.3 points.
What the record shows: a day without a loss is not a day without risk. Basket 2 spent about three and a half hours below its entry on both charts (13:00–16:30) before the market came back; the record shows where it went, not only where it ended.
What happened, in order
- 06:50–06:51 — basket 1: bought NDX at 30,448.2 and SP500 at 7,796.4, in the European early morning.
- 11:11 — basket 1 closed: NDX at 30,498.6 (+50.4 points), SP500 at 7,806.0 (+9.6 points), after 4 h 20 min.
- 11:22 — basket 2: bought NDX at 30,504.2 and SP500 at 7,807.0, eleven minutes after closing basket 1, a few points higher.
- 13:00–16:30 — both indices fell below basket 2's entries and stayed there until the US open. After the open NDX moved back above its entry; SP500 hovered around and below its entry until the evening.
- 04:32–04:33 next morning — basket 2 closed: NDX at 30,577.5 (+73.3 points), SP500 at 7,808.2 (+1.2 points), after 17 h 10 min.
Each basket paired SP500 and NDX; basket 1 at 1.5 : 0.2 lots, basket 2 at 0.8 : 0.1.
Market context
On Tuesday 13 October the S&P 500 closed almost unchanged at 7,805–7,806 (−0.02 %), the Nasdaq Composite at 27,204.38 (−0.15 %) and the Dow at 51,670 (−0.35 %). Bank earnings were mixed — JPMorgan missed its profit estimate, Goldman Sachs beat — and memory-chip stocks fell again on reports of advances by China's ChangXin Memory Technologies. The 10-year Treasury yield eased to about 5.21 %; Brent ended near $106 a barrel. Investors were waiting for Wednesday's CPI report. Sources at the end.
Costs of the day
Commission on all four positions and overnight financing on the two legs of basket 2; no dividend adjustments. Costs took 5.4 % of the day's gross trading result — almost all of it the night: financing on basket 2 was four times the day's total commission. They are part of the record, so they are part of every report.
What XFX investors saw
DARWIN XFX replicates this account's positions through Darwinex's risk engine, which targets a monthly value-at-risk of 6.5 % (95 %) and scales position sizes accordingly. An investor's result for 13–14 October is therefore the change in the DARWIN's quote, published on the XFX page at Darwinex, not the figures above. That is also why these reports are written in points, not currency: points describe the trading; the DARWIN's quote describes the investment.
About the charts
Entry and exit prices and times are the account's real fills. The market lines are public reference series at 5-minute closes, via Yahoo Finance: the Nasdaq-100 E-mini futures (shifted down by 231.9 points) and the S&P 500 E-mini futures (shifted down by 50.1 points). Each shift is the average gap between the reference series and the account's CFD price at that instrument's fills, so that the line sits on the same price scale as the fills. The gap in the lines around 00:00–01:00 is the futures' daily trading pause. The shape of the day is the market's; the levels of the fills are the account's.
Sources
- TheStreet – Stock Market Today (Oct. 13, 2026): Nasdaq, S&P 500 flat as mixed bank earnings and chip weakness weigh on stocks (S&P 500 7,805.45 −0.02 %, Nasdaq 27,204.38 −0.15 %, Dow 51,670.10 −0.35 %): https://www.thestreet.com/stock-market-today/stock-market-today-dow-jones-sp-500-nasdaq-updates-oct-13-2026
- Investing.com – Wall Street ends marginally lower after softness in memory stocks, bank earnings (S&P 500 7,806.26, Nasdaq 27,204.38, Dow 51,670.99, 10-year 5.209 %, Brent $106.13): https://www.investing.com/news/stock-market-news/us-stock-futures-steady-as-bank-earnings-inflation-data-loom-4945262
- Yahoo Finance – 5-minute chart data, 13–14 October 2026 (market lines of the charts): E-mini Nasdaq-100 https://finance.yahoo.com/quote/NQ=F/ · E-mini S&P 500 https://finance.yahoo.com/quote/ES=F/
- Darwinex – DARWIN XFX (VaR target): https://www.darwinex.com/invest/XFX
- Trading account history (MetaTrader 5): closed positions opened on 13 October 2026