
Trade report, 15 October 2026: four positions, one exit
Four long positions closed together at 18:12: EURUSD −11.1 pips and NDX −11.2 points first, then SP500 +25.0 points and GBPUSD +3.7 pips. Nothing held overnight; entry and exit charts for each instrument.
Platform time UTC+3. Every entry, exit and result comes from the trading account's closed-position history. Returns for XFX investors are produced by Darwinex's risk engine and differ from these numbers — see the last section.
The trades, on the charts
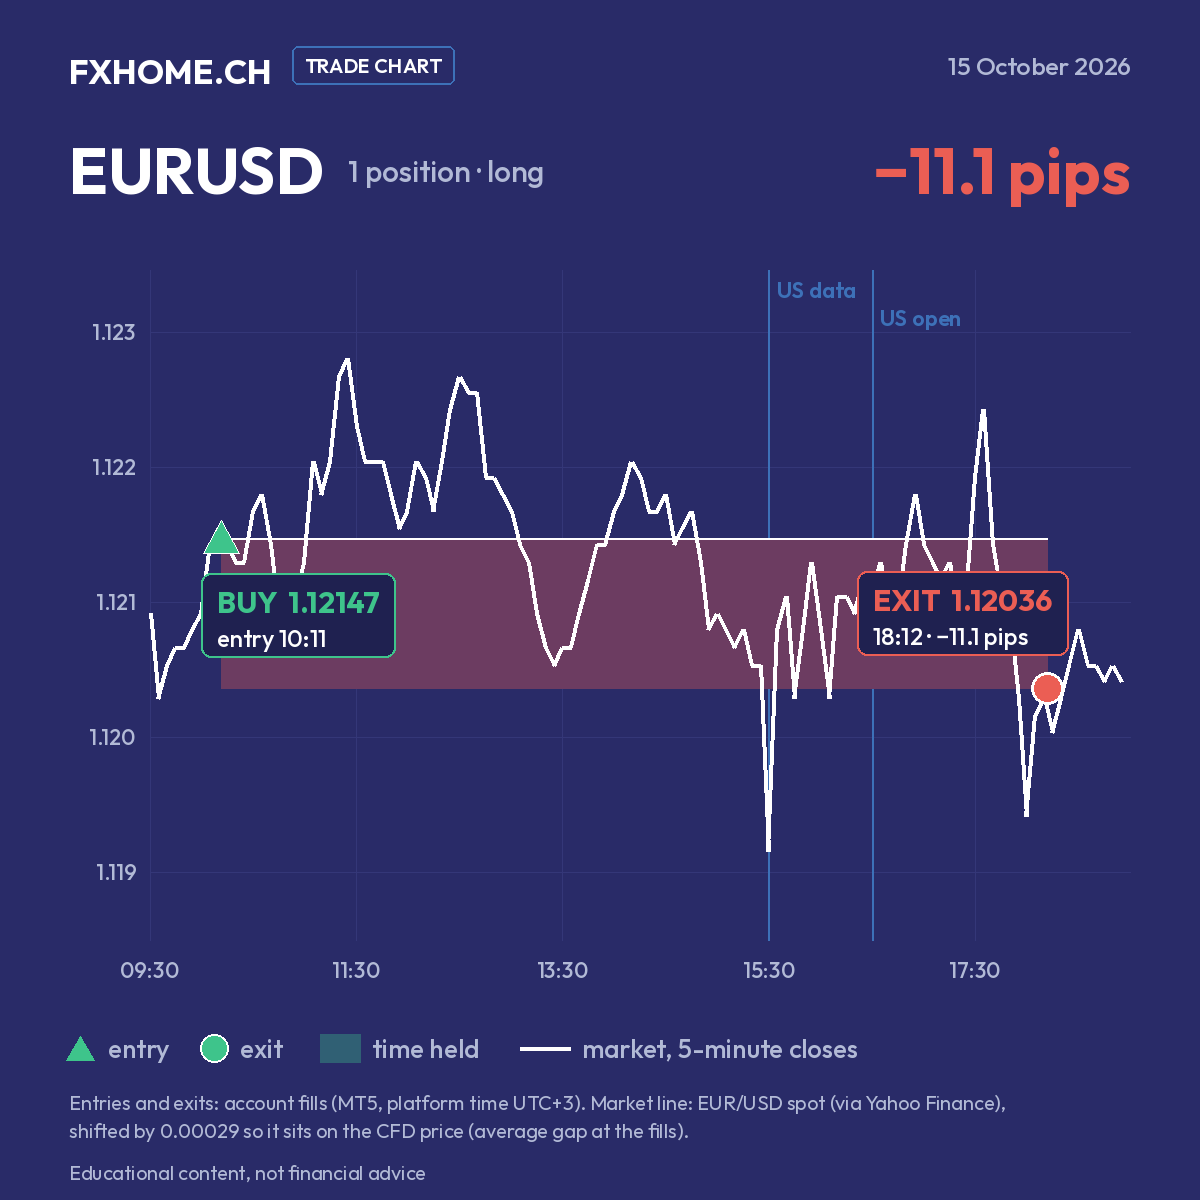
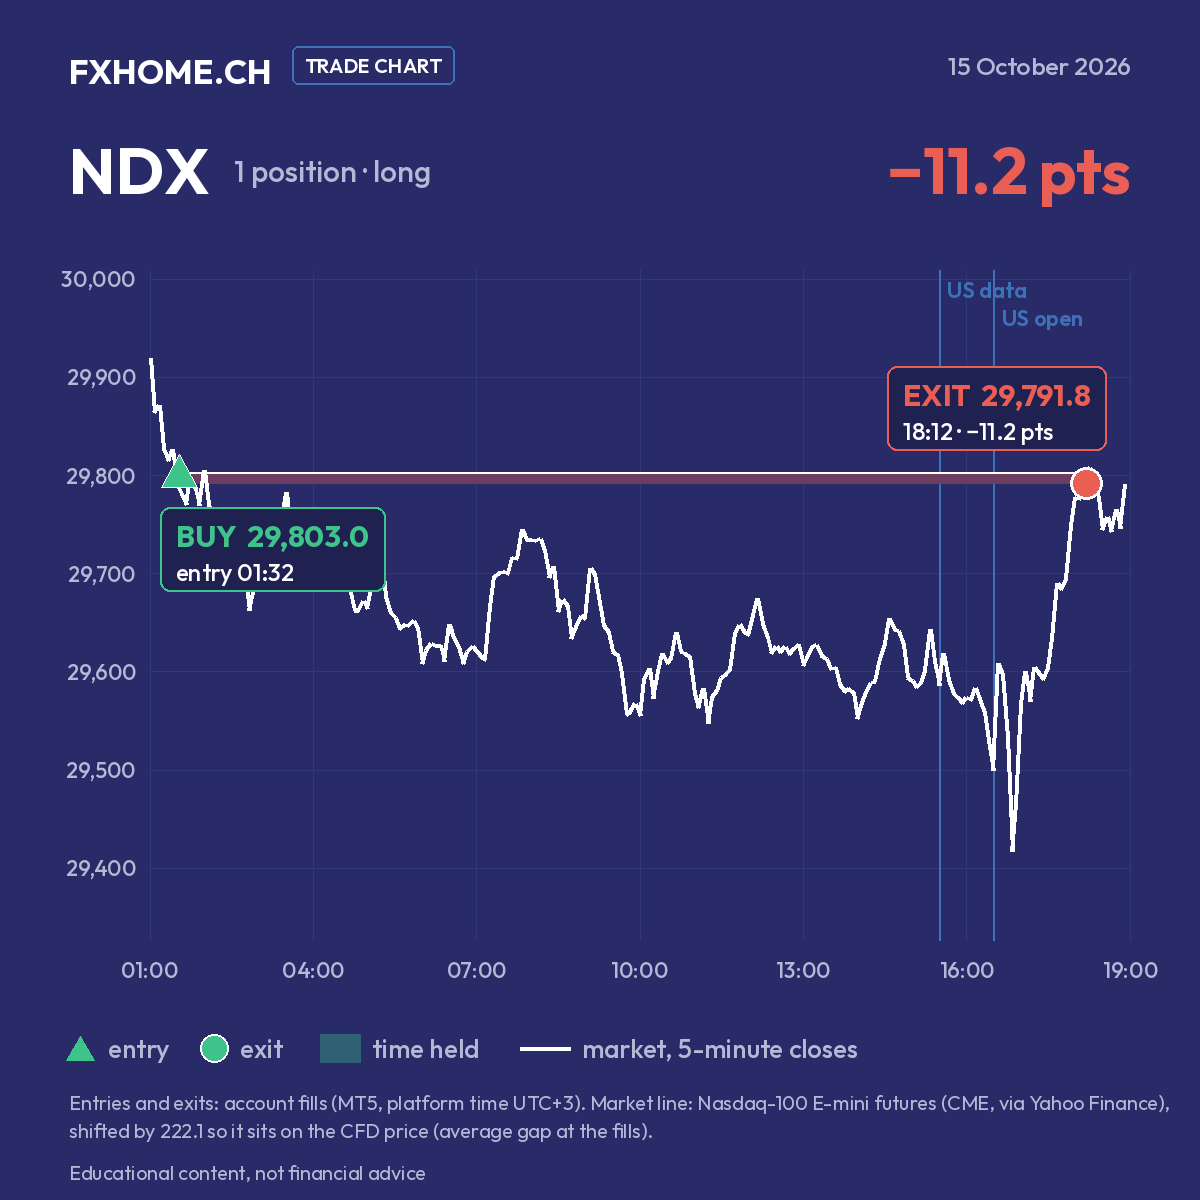
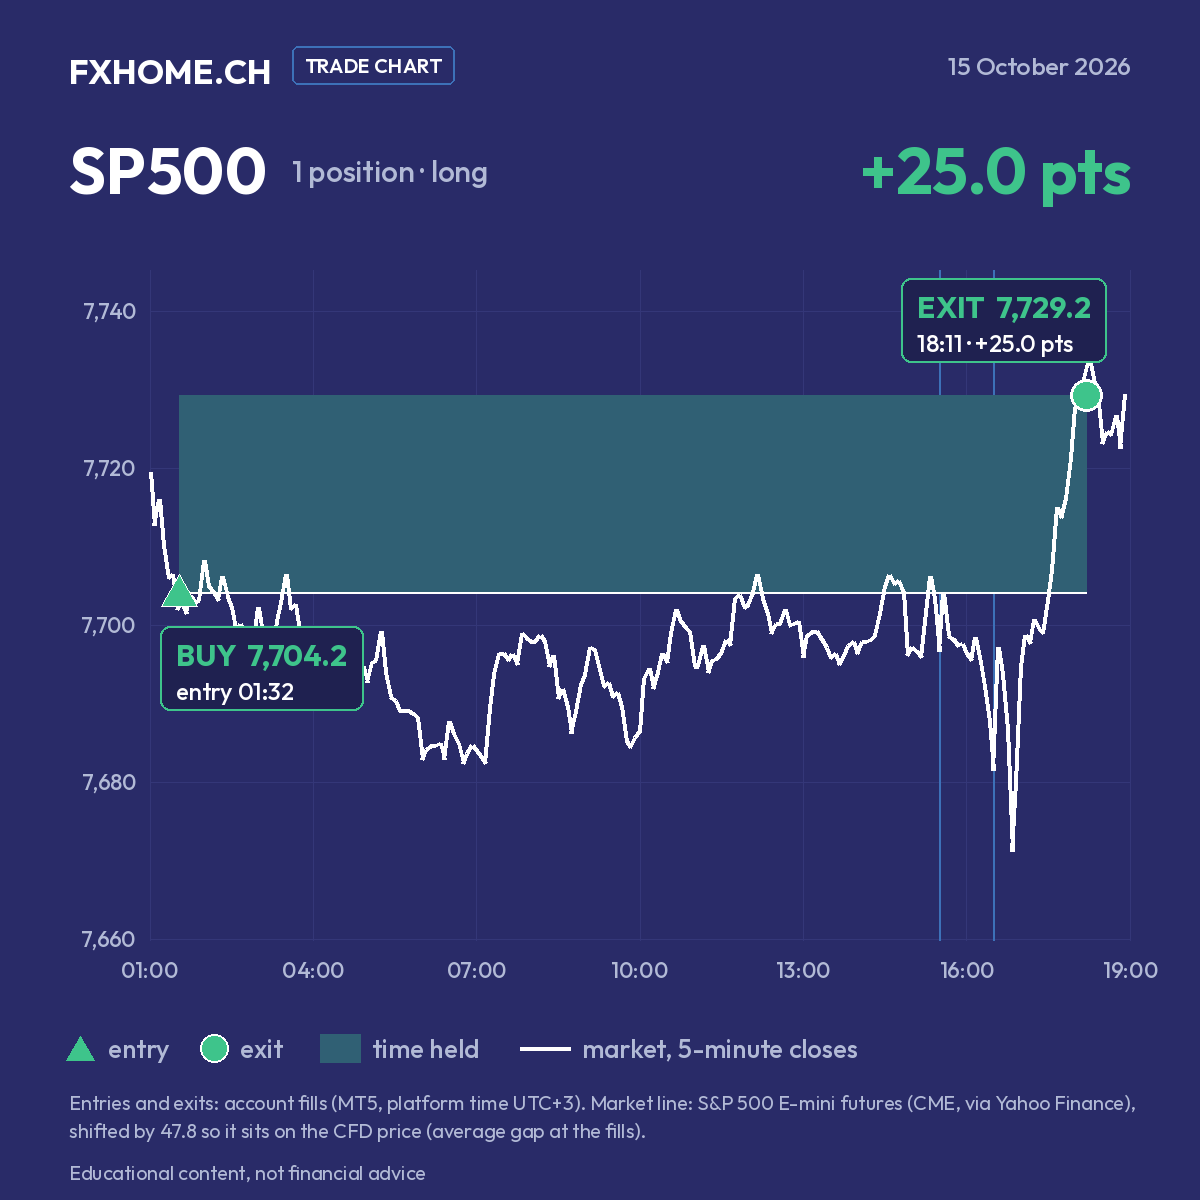
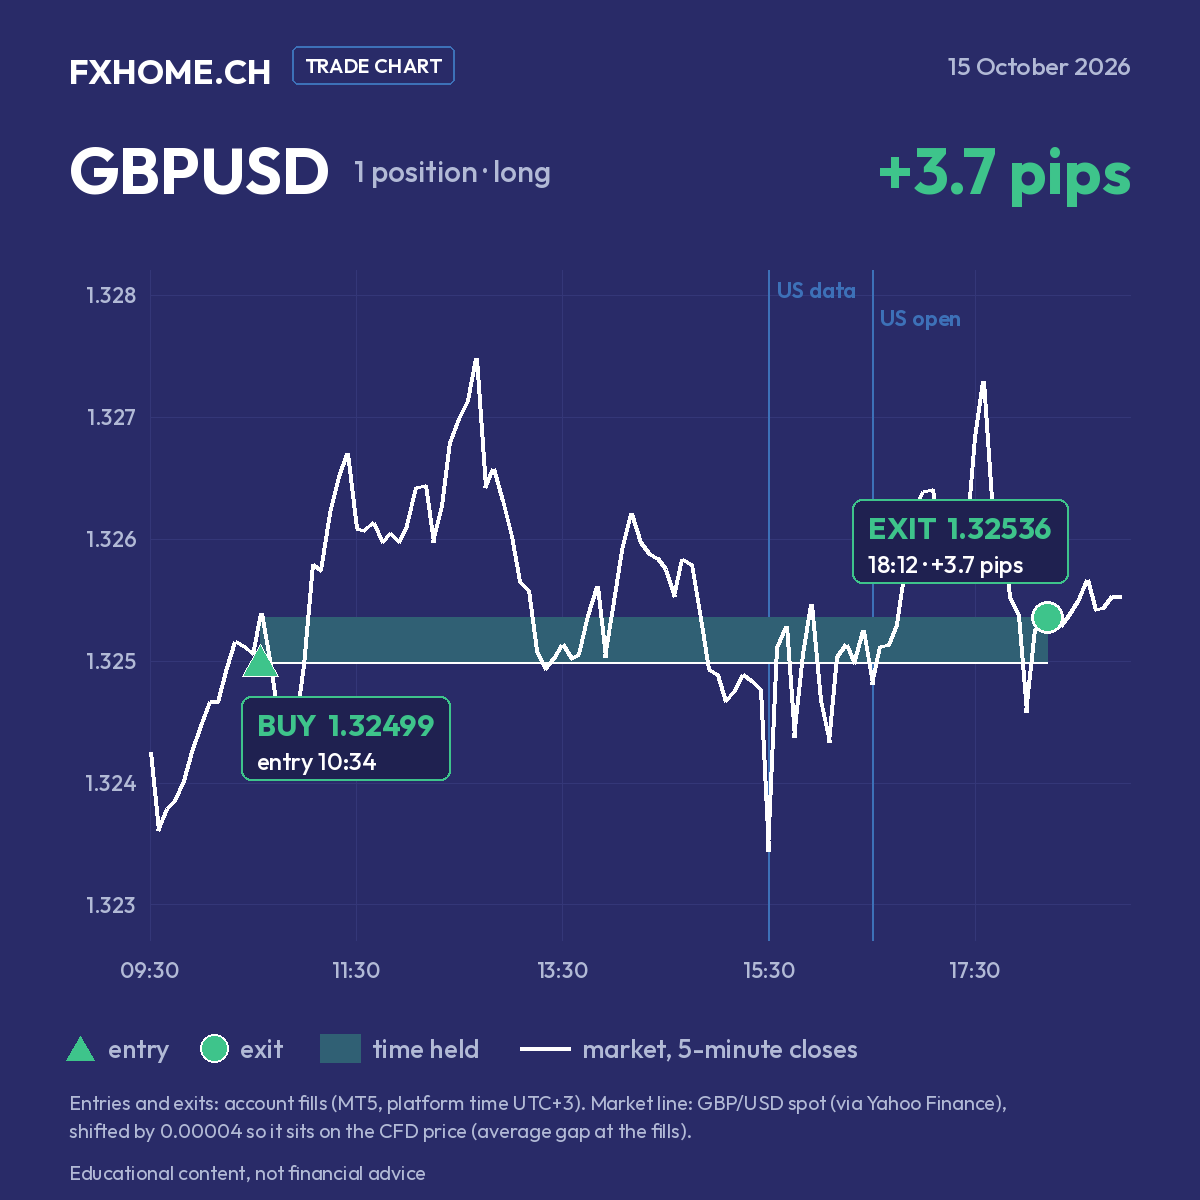
Four long positions: one index basket (SP500 and NDX, opened together in the night) and two currency positions, EURUSD and GBPUSD, opened in the European morning. All four were closed together at 18:12, within 12 seconds. One chart per instrument, the losers first. The green triangle is the entry, the dot the exit (green closed up, red closed down), and the shaded band the time the position was held.
| # | What | Entry | Exit | Result |
|---|---|---|---|---|
| EURUSD | ▲ long | 1.12147 10:11 |
1.12036 18:12 |
−11.1 pips |
| NDX | ▲ long index basket |
29,803.0 01:32 |
29,791.8 18:12 |
−11.2 pts |
| SP500 | ▲ long index basket |
7,704.2 01:32 |
7,729.2 18:11 |
+25.0 pts |
| GBPUSD | ▲ long | 1.32499 10:34 |
1.32536 18:12 |
+3.7 pips |
▲ long (bought) · nothing held overnight
The loss, first
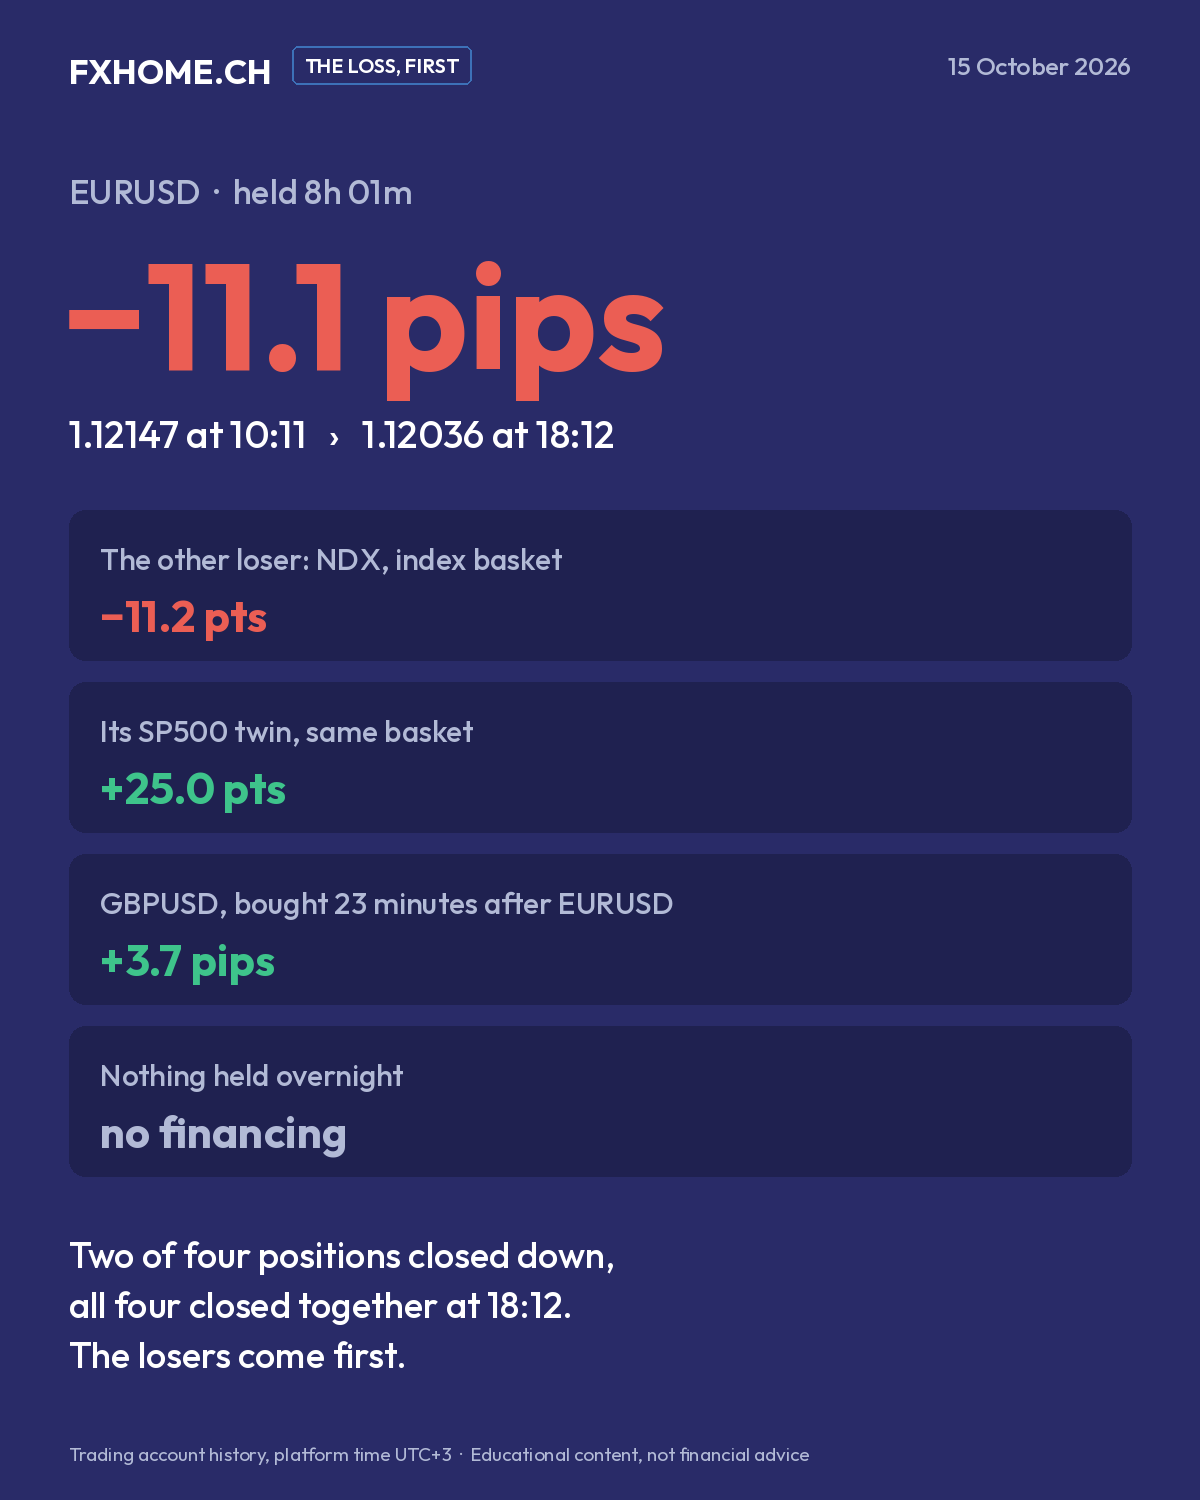
Two of the four positions closed down. EURUSD was bought at 1.12147 at 10:11 and closed at 1.12036 at 18:12 — −11.1 pips after 8 h 01 min. On the chart the pair rose in the first hour and a half after the entry, then spent most of the afternoon below it. NDX, bought at 29,803.0 at 01:32 as half of the index basket, closed at 29,791.8 — −11.2 points after 16 h 39 min; its SP500 twin in the same basket closed +25.0 points.
What the record shows: all four positions were closed at the same moment, so each result is simply where its instrument stood at 18:12. NDX had been much lower during the day — on the chart its low came after the US open — and was back just under its entry at the exit. GBPUSD, bought 23 minutes after EURUSD, closed +3.7 pips while EURUSD closed −11.1: two similar positions, two different results.
What happened, in order
- 01:32 — index basket: bought NDX at 29,803.0 and SP500 at 7,704.2, eight seconds apart. Both indices drifted lower through the night and the morning.
- 10:11 — bought EURUSD at 1.12147.
- 10:34 — bought GBPUSD at 1.32499.
- 15:30 — US economic data. On the charts both currency pairs dropped sharply in the 15:30 bar and recovered in the next one.
- 16:30 — US open. Both index futures swung sharply; NDX made its low of the day around 16:50, then both indices rose into the evening.
- 18:11:58–18:12:10 — all four positions closed: SP500 +25.0 points, NDX −11.2 points, GBPUSD +3.7 pips, EURUSD −11.1 pips.
The index basket paired SP500 and NDX at 0.7 : 0.1 lots; EURUSD and GBPUSD were 0.3 lots each.
Market context
On Thursday 15 October US producer prices for September rose faster than expected — +6.3 % on the year against about 5.3–5.5 % forecast, the largest gain since 2022 — a day after the hot consumer price report. Stocks recovered from a weak open as Treasury yields fell: the 10-year yield ended near 5.09 %. The Dow closed at about 52,177 (+1.08 %), the S&P 500 at about 7,744 (+0.33 %) and the Nasdaq Composite at about 26,713 (+0.08 %), with technology lagging and defensive sectors leading. The dollar index fell about 0.5 %. Sources at the end.
Costs of the day
Commission on all four positions; no overnight financing and no dividend adjustments. Costs took 3.4 % of the day's gross trading result. They are part of the record, so they are part of every report.
What XFX investors saw
DARWIN XFX replicates this account's positions through Darwinex's risk engine, which targets a monthly value-at-risk of 6.5 % (95 %) and scales position sizes accordingly. An investor's result for 15 October is therefore the change in the DARWIN's quote, published on the XFX page at Darwinex, not the figures above. That is also why these reports are written in points and pips, not currency: they describe the trading; the DARWIN's quote describes the investment.
About the charts
Entry and exit prices and times are the account's real fills. The market lines are public reference series at 5-minute closes, via Yahoo Finance: the Nasdaq-100 E-mini futures (shifted down by 222.1 points), the S&P 500 E-mini futures (shifted down by 47.8 points), EUR/USD spot (shifted by 0.00029) and GBP/USD spot (shifted by 0.00004). Each shift is the average gap between the reference series and the account's CFD price at that instrument's fills, so that the line sits on the same price scale as the fills. The index charts show 01:00–19:00; the currency charts 09:30–19:00. The shape of the day is the market's; the levels of the fills are the account's.
Sources
- Investrade – Market Review: October 15, 2026 (Dow 52,177 +1.08 %, S&P 500 7,744 +0.33 %, Nasdaq 26,713 +0.08 %; PPI +6.3 % y/y vs +5.3 %; 10-year about 5.09 %; dollar index −0.5 %): https://investrade.com/market-review-october-15-2026/
- TheStreet – Stock Market Today (Oct. 15, 2026) (PPI +6.3 % y/y, biggest gain since 2022, vs 5.5 % expected; 10-year 5.085 %, −10.5 bp; Dow +1.04 %, S&P 500 +0.30 % intraday): https://www.thestreet.com/stock-market-today/stock-market-today-dow-jones-sp-500-nasdaq-updates-oct-15-2026
- Alain Guillot – Stock Market Recap — October 15, 2026 (Dow ≈ +1.1 %, S&P 500 +0.3 %, Nasdaq modestly higher; 10-year ≈ 5.09 %): https://alainguillot.com/stock-market-recap-october-15-2026
- Yahoo Finance – 5-minute chart data, 15 October 2026 (market lines of the charts): E-mini Nasdaq-100 https://finance.yahoo.com/quote/NQ=F/ · E-mini S&P 500 https://finance.yahoo.com/quote/ES=F/ · EUR/USD https://finance.yahoo.com/quote/EURUSD=X/ · GBP/USD https://finance.yahoo.com/quote/GBPUSD=X/
- Darwinex – DARWIN XFX (VaR target): https://www.darwinex.com/invest/XFX
- Trading account history (MetaTrader 5): closed positions opened on 15 October 2026