
House prices up by 4.0% in the euro area
Source: Eurostat, ec.europa.eu/eurostat. Reproducido sin cambios bajo la licencia Creative Commons Atribución 4.0 Internacional. Documento original ↗
Overview
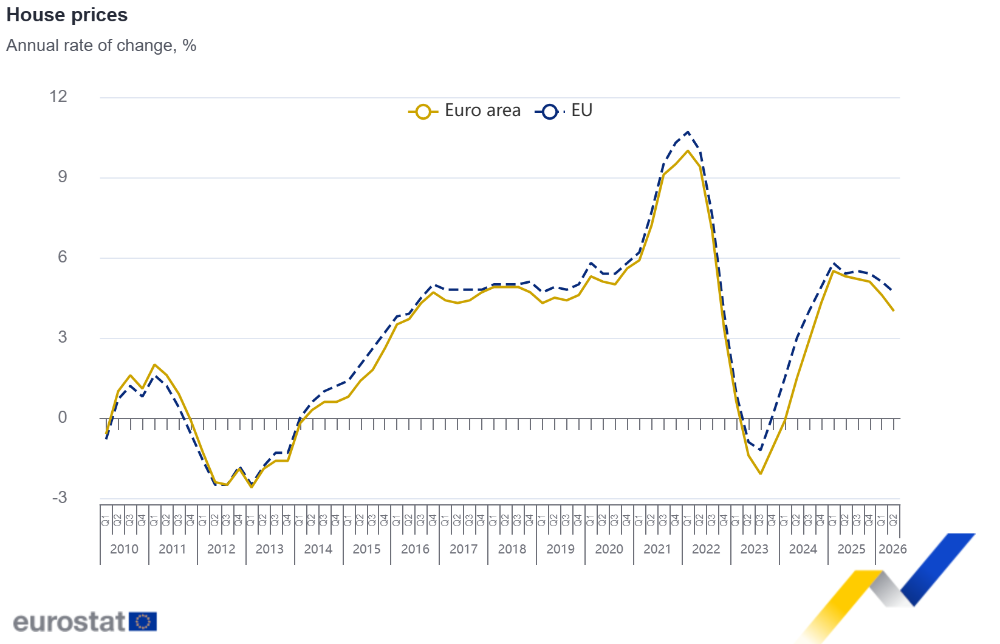
In the second quarter of 2026, house prices, as measured by the House Price Index, increased by 4.0% in the euro area and by 4.7% in the EU compared with the same quarter of the previous year. In the first quarter of 2026, house prices increased by 4.6% and 5.1% in the euro area and EU, respectively. These figures come from Eurostat, the statistical office of the European Union.
Compared with the first quarter of 2026, house prices increased by 1.1% in the euro area and by 1.2% in the EU in the second quarter of 2026.
House price developments in the EU Member States
Among the Member States for which data are available, three countries showed an annual decrease in house prices in the second quarter of 2026, and twenty-three showed an annual increase. The falls were registered in Finland (-2.7%), Luxembourg (-2.2%) and France (-0.8%). The highest increase was recorded in Portugal (+16.5%), followed by Bulgaria (+15.5%) and Lithuania (+14.3%).
Compared with the previous quarter, prices decreased in two Member States, and increased in twenty-four Member States. The falls were registered in Hungary (-1.4%) and France (-0.8%), while the highest increases were recorded in Lithuania (+5.0%), Bulgaria (+4.5%) and Romania (+4.4%).
Table
Quarterly and annual changes in house prices |
||||||||
|---|---|---|---|---|---|---|---|---|
Change compared with the previous quarter, % |
Change compared with the same quarter of the previous year, % |
|||||||
2025 |
2026 |
2025 |
2026 |
|||||
Q3 |
Q4 |
Q1 |
Q2 |
Q3 |
Q4 |
Q1 |
Q2 |
|
Euro area |
1.5 |
0.4 |
0.9 |
1.1 |
5.2 |
5.1 |
4.6 |
4.0 |
EU |
1.6 |
0.7 |
1.1 |
1.2 |
5.5 |
5.4 |
5.1 |
4.7 |
Belgium |
2.4 |
0.5 |
-0.9 |
0.1 |
3.7 |
3.5 |
1.9 |
2.1 |
Bulgaria |
3.8 |
0.3 |
6.2 |
4.5 |
15.4 |
12.6 |
14.8 |
15.5 |
Czechia |
2.4 |
2.1 |
2.0 |
1.8 |
10.8 |
10.3 |
10.0 |
8.6 |
Denmark |
2.1 |
1.4 |
2.8 |
2.8 |
6.3 |
7.6 |
8.2 |
9.4 |
Germany |
0.7 |
-0.5 |
0.1 |
0.3 |
3.2 |
2.6 |
1.2 |
0.6 |
Estonia |
-0.8 |
-0.3 |
3.4 |
3.5 |
5.2 |
5.5 |
5.9 |
5.8 |
Ireland |
2.6 |
1.9 |
0.8 |
0.5 |
7.5 |
7.0 |
6.8 |
6.0 |
Greece |
: |
: |
: |
: |
: |
: |
: |
: |
Spain |
2.9 |
1.8 |
3.5 |
3.4 |
12.8 |
12.9 |
12.8 |
12.1 |
France |
1.5 |
-0.8 |
-0.7 |
-0.8 |
0.7 |
0.9 |
0.0 |
-0.8 |
Croatia |
2.9 |
3.3 |
3.3 |
2.7 |
13.3 |
15.9 |
14.3 |
12.7 |
Italy |
0.5 |
0.9 |
0.9 |
1.7 |
3.7 |
4.0 |
5.1 |
4.0 |
Cyprus |
3.7 |
0.0 |
1.6 |
2.4 |
4.2 |
6.0 |
3.4 |
7.9 |
Latvia |
4.8 |
1.5 |
0.7 |
3.9 |
7.9 |
10.5 |
10.3 |
11.4 |
Lithuania |
2.9 |
2.4 |
3.3 |
5.0 |
10.8 |
10.8 |
11.9 |
14.3 |
Luxembourg |
-3.6 |
0.0 |
0.3 |
1.1 |
1.0 |
-0.1 |
1.3 |
-2.2 |
Hungary |
6.6 |
3.3 |
1.4 |
-1.4 |
21.7 |
21.0 |
14.1 |
10.2 |
Malta |
1.9 |
1.5 |
1.8 |
1.6 |
6.0 |
6.3 |
6.8 |
6.9 |
Netherlands |
2.2 |
0.5 |
1.1 |
0.5 |
7.9 |
6.2 |
5.3 |
4.3 |
Austria |
0.6 |
0.2 |
0.9 |
3.3 |
1.7 |
3.1 |
2.8 |
5.1 |
Poland |
0.9 |
1.5 |
2.3 |
1.5 |
4.0 |
4.3 |
5.9 |
6.3 |
Portugal |
4.1 |
4.0 |
3.8 |
3.6 |
17.7 |
18.9 |
17.8 |
16.5 |
Romania |
2.3 |
1.7 |
3.2 |
4.4 |
6.6 |
6.7 |
7.8 |
12.1 |
Slovenia |
0.6 |
2.3 |
2.9 |
3.0 |
7.1 |
7.4 |
9.3 |
9.1 |
Slovakia |
4.9 |
3.1 |
3.6 |
1.4 |
13.4 |
12.8 |
14.4 |
13.6 |
Finland |
-1.5 |
-0.7 |
-0.8 |
0.3 |
-2.7 |
-2.6 |
-2.0 |
-2.7 |
Sweden |
0.3 |
0.5 |
2.1 |
1.9 |
0.3 |
1.2 |
2.6 |
4.8 |
Iceland |
1.0 |
0.5 |
-0.2 |
1.4 |
3.5 |
3.3 |
2.8 |
2.7 |
Norway |
-0.5 |
-0.6 |
3.7 |
1.7 |
5.1 |
5.7 |
4.6 |
4.2 |
Switzerland |
0.8 |
0.5 |
1.5 |
0.7 |
5.2 |
3.9 |
4.7 |
3.5 |
: not available Source datasets: prc_hpi_q (compared with the previous quarter) and prc_hpi_q (compared with the same quarter of the previous year)
|
||||||||

Notes for users
Revisions and timetable
Compared with Euro indicators release of 2 July 2026, revisions for the euro area and the EU are highlighted in bold in the table below:
Revisions |
||||||
|---|---|---|---|---|---|---|
Q3 2025 |
Q4 2025 |
Q1 2026 |
||||
Quarterly changes |
Previous |
Current |
Previous |
Current |
Previous |
Current |
Euro area |
1.5 |
1.5 |
0.5 |
0.4 |
1.0 |
0.9 |
EU |
1.6 |
1.6 |
0.7 |
0.7 |
1.2 |
1.1 |
Annual changes |
||||||
|---|---|---|---|---|---|---|
Euro area |
5.2 |
5.2 |
5.1 |
5.1 |
4.7 |
4.6 |
EU |
5.5 |
5.5 |
5.4 |
5.4 |
5.1 |
5.1 |
|
||||||
The next release with data (third quarter of 2026) is scheduled for 11 January 2027.
Methods and definitions
The House Price Index (HPI) measures the price changes of all residential properties purchased by households (flats, detached houses, terraced houses, etc.), both newly built and existing, independently of their final use and independently of their previous owners. The Member States’ HPIs are compiled by the National Statistical Institutes. The euro area and the EU aggregate HPIs are compiled by Eurostat. HPIs are computed as annually chained indices with weights being updated each year. The European HPI aggregates are currently calculated as weighted averages of the national HPIs using as weights the GDP at market prices (expressed in millions Purchasing Power Standards - PPS) of the countries concerned.
The figures are not seasonally adjusted.
Missing country data is estimated by Eurostat using data from non-harmonised sources. These estimates are not published but are used to calculate euro area and EU aggregates.
Geographical information
Euro area (EA21): Belgium, Bulgaria, Germany, Estonia, Ireland, Greece, Spain, France, Croatia, Italy, Cyprus, Latvia, Lithuania, Luxembourg, Malta, the Netherlands, Austria, Portugal, Slovenia, Slovakia and Finland.
European Union (EU27): Belgium, Bulgaria, Czechia, Denmark, Germany, Estonia, Ireland, Greece, Spain, France, Croatia, Italy, Cyprus, Latvia, Lithuania, Luxembourg, Hungary, Malta, the Netherlands, Austria, Poland, Portugal, Romania, Slovenia, Slovakia, Finland and Sweden.
For more information
Source: Eurostat, ec.europa.eu/eurostat. Documento original ↗