
Annual inflation up to 3.2% in the euro area
Source: Eurostat, ec.europa.eu/eurostat. Reproducido sin cambios bajo la licencia Creative Commons Atribución 4.0 Internacional. Documento original ↗
Overview
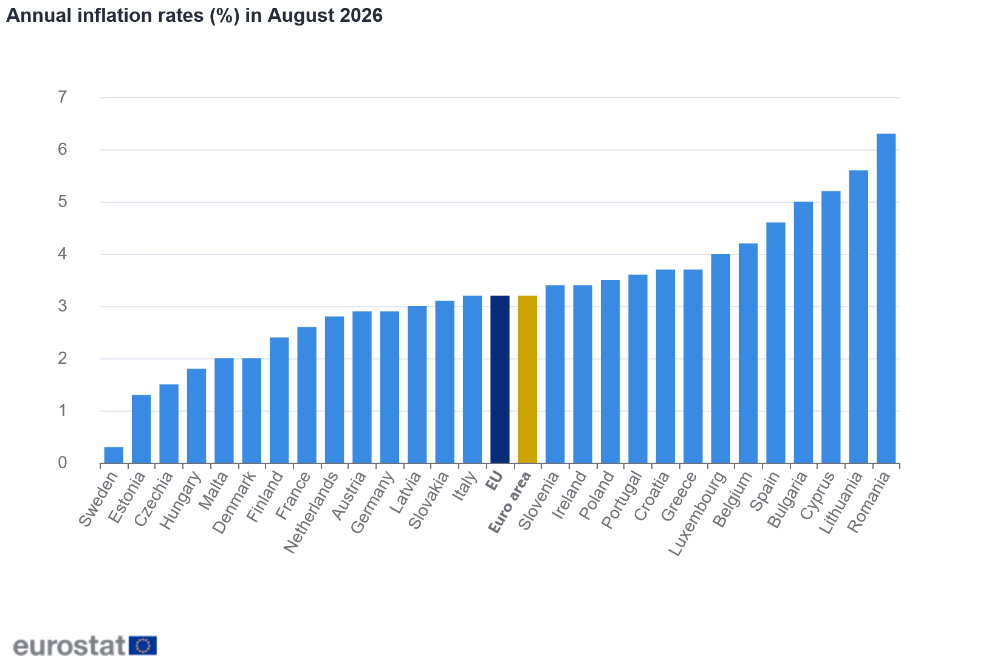
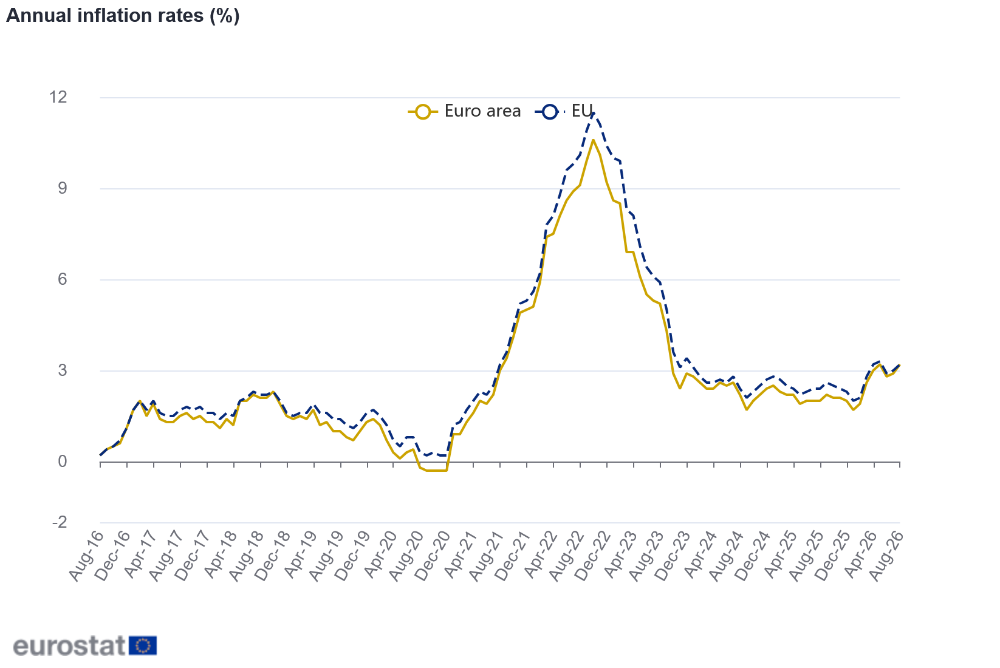
The euro area annual inflation rate was 3.2% in August 2026, up from 2.9% in July. A year earlier, the rate was 2.0%. European Union annual inflation was 3.2% in August 2026, up from 3.0% in July. A year earlier, the rate was 2.4%. These figures are published by Eurostat, the statistical office of the European Union.
The lowest annual rates were registered in Sweden (0.3%), Estonia (1.3%) and Czechia (1.5%). The highest annual rates were recorded in Romania (6.3%), Lithuania (5.6%) and Cyprus (5.2%). Compared with July 2026, annual inflation fell in six Member States, remained stable in one and rose in twenty.
In August 2026, services (+1.43 percentage points, pp), energy (+1.29 percentage points, pp), non-energy industrial goods (+0.30 percentage points, pp) and food, alcohol & tobacco (+0.22 percentage points, pp) contributed positively to the annual euro area inflation rate.
Inflation rates (%) measured by the HICP |
||||||||
|---|---|---|---|---|---|---|---|---|
Annual rate |
Monthly rate |
|||||||
Aug 25 |
Mar 26 |
Apr 26 |
May 26 |
Jun 26 |
Jul 26 |
Aug 26 |
Aug 26 |
|
Euro area |
2.0 |
2.6 |
3.0 |
3.2 |
2.8 |
2.9 |
3.2 |
0.4 |
EU |
2.4 |
2.8 |
3.2 |
3.3 |
2.9 |
3.0 |
3.2 |
0.4 |
Belgium |
2.6 |
2.2 |
4.2 |
4.0 |
3.3 |
3.6 |
4.2 |
2.0 |
Bulgaria |
3.5 |
2.8 |
6.0 |
6.3 |
5.2 |
4.4 |
5.0 |
0.8 |
Czechia |
2.3 |
1.5 |
2.1 |
1.8 |
1.1 |
1.3 |
1.5 |
0.3 |
Denmark |
1.9 |
1.0 |
1.2 |
1.8 |
1.8 |
1.6 |
2.0 |
-0.4 |
Germany |
2.0 |
2.8 |
2.9 |
2.7 |
2.4 |
2.8 |
2.9 |
0.2 |
Estonia |
6.2 |
3.5 |
3.2 |
3.6 |
2.0 |
2.0 |
1.3 |
0.3 |
Ireland |
1.9 |
3.6 |
3.6 |
3.5 |
3.2 |
3.1 |
3.4 |
0.6 |
Greece |
3.1 |
3.4 |
4.6 |
4.9 |
3.9 |
2.7 |
3.7 |
0.4 |
Spain |
2.7 |
3.4 |
3.5 |
3.6 |
3.6 |
3.9 |
4.6 |
0.7 |
France |
0.8 |
2.0 |
2.5 |
2.8 |
2.0 |
2.4 |
2.6 |
0.7 |
Croatia |
4.6 |
4.6 |
5.4 |
4.9 |
4.2 |
3.6 |
3.7 |
0.3 |
Italy |
1.6 |
1.6 |
2.8 |
3.2 |
3.0 |
2.9 |
3.2 |
0.1 |
Cyprus |
0.0 |
1.5 |
3.0 |
3.5 |
4.1 |
4.4 |
5.2 |
1.5 |
Latvia |
4.2 |
3.4 |
2.9 |
3.5 |
3.3 |
2.5 |
3.0 |
0.3 |
Lithuania |
3.6 |
4.4 |
4.9 |
5.1 |
5.4 |
5.4 |
5.6 |
-0.1 |
Luxembourg |
2.8 |
3.8 |
5.2 |
4.5 |
3.7 |
3.4 |
4.0 |
1.8 |
Hungary |
4.2 |
2.1 |
2.6 |
2.3 |
2.1 |
1.6 |
1.8 |
0.2 |
Malta |
2.7 |
2.3 |
2.5 |
2.1 |
2.0 |
2.1 |
2.0 |
0.6 |
Netherlands |
2.4 |
2.6 |
2.5 |
3.4 |
2.5 |
3.0 |
2.8 |
0.1 |
Austria |
4.1 |
3.2 |
3.4 |
3.7 |
3.2 |
2.7 |
2.9 |
0.5 |
Poland |
2.8 |
3.2 |
3.4 |
3.3 |
3.0 |
3.1 |
3.5 |
0.3 |
Portugal |
2.5 |
2.7 |
3.3 |
3.1 |
3.1 |
3.1 |
3.6 |
0.3 |
Romania |
8.5 |
9.0 |
9.5 |
9.7 |
9.2 |
8.2 |
6.3 |
0.3 |
Slovenia |
3.0 |
2.4 |
3.4 |
3.8 |
3.7 |
3.0 |
3.4 |
0.3 |
Slovakia |
4.4 |
3.7 |
4.1 |
4.0 |
3.5 |
3.2 |
3.1 |
0.0 |
Finland |
2.3 |
2.5 |
2.4 |
2.8 |
2.7 |
2.5 |
2.4 |
-0.3 |
Sweden |
3.4 |
1.5 |
0.5 |
1.1 |
1.0 |
0.3 |
0.3 |
-0.3 |
Iceland |
3.7 |
5.0 |
4.9 |
4.8 |
5.1 |
5.6 |
6.1 |
0.3 |
Norway |
3.5 |
3.6 |
3.4 |
3.1 |
2.6 |
2.9 |
3.2 |
-0.5 |
Switzerland |
0.0 |
0.6 |
0.5 |
0.9 |
0.7 |
0.7 |
0.9 |
0.1 |
Source dataset: prc_hicp_minr
|
||||||||

Tables
Euro area inflation rate (%), selected aggregates |
|||||||||
|---|---|---|---|---|---|---|---|---|---|
Weights (‰) |
Annual rate |
Monthly rate |
|||||||
2026 |
Aug 25 |
Mar 26 |
Apr 26 |
May 26 |
Jun 26 |
Jul 26 |
Aug 26 |
Aug 26 |
|
All-items HICP |
1000.0 |
2.0 |
2.6 |
3.0 |
3.2 |
2.8 |
2.9 |
3.2 |
0.4 |
All-items excluding: energy |
909.7 |
2.5 |
2.3 |
2.2 |
2.4 |
2.2 |
2.2 |
2.1 |
0.2 |
energy, unprocessed food |
858.3 |
2.3 |
2.2 |
2.1 |
2.3 |
2.1 |
2.2 |
2.1 |
0.2 |
energy, food, alcohol & tobacco |
720.4 |
2.3 |
2.3 |
2.2 |
2.6 |
2.4 |
2.5 |
2.4 |
0.2 |
energy, seasonal food |
884.3 |
2.4 |
2.3 |
2.2 |
2.4 |
2.2 |
2.2 |
2.1 |
0.2 |
tobacco |
979.8 |
2.0 |
2.5 |
3.0 |
3.1 |
2.7 |
2.9 |
3.2 |
0.4 |
Food, alcohol & tobacco |
189.4 |
3.2 |
2.4 |
2.4 |
1.9 |
1.5 |
1.2 |
1.1 |
0.0 |
processed food, alcohol & tobacco |
137.9 |
2.7 |
1.7 |
1.6 |
1.1 |
0.9 |
0.7 |
0.5 |
0.0 |
unprocessed food |
51.4 |
4.4 |
4.2 |
4.6 |
4.0 |
3.1 |
2.4 |
2.7 |
-0.1 |
Energy |
90.3 |
-2.0 |
5.1 |
10.8 |
10.8 |
8.5 |
10.3 |
14.3 |
2.9 |
Non-energy industrial goods |
252.2 |
0.7 |
0.5 |
0.8 |
0.9 |
0.7 |
0.9 |
1.2 |
0.6 |
Services |
468.2 |
3.1 |
3.2 |
3.0 |
3.5 |
3.2 |
3.3 |
3.0 |
0.0 |
Source dataset: prc_hicp_minr and prc_hicp_iw
|
|||||||||
Contributions to the euro area annual inflation rate (pp), selected aggregates |
|||||||
|---|---|---|---|---|---|---|---|
Aug 25 |
Mar 26 |
Apr 26 |
May 26 |
Jun 26 |
Jul 26 |
Aug 26 |
|
Food, alcohol & tobacco |
0.61 |
0.45 |
0.46 |
0.36 |
0.29 |
0.23 |
0.22 |
processed food, alcohol & tobacco |
0.39 |
0.23 |
0.22 |
0.15 |
0.13 |
0.10 |
0.07 |
unprocessed food |
0.23 |
0.22 |
0.24 |
0.21 |
0.16 |
0.12 |
0.14 |
Energy |
-0.19 |
0.48 |
0.99 |
0.98 |
0.77 |
0.94 |
1.29 |
Non-energy industrial goods |
0.18 |
0.13 |
0.20 |
0.23 |
0.18 |
0.23 |
0.30 |
Services |
1.44 |
1.49 |
1.38 |
1.61 |
1.51 |
1.55 |
1.43 |
Source dataset: prc_hicp_ctr
|
|||||||
Notes for users
Revisions and timetable
A flash estimate of euro area inflation is issued at the end of each reference month. The euro area flash estimate for August 2026, published on 1 September 2026, was 3.3%.
The next flash estimate of euro area inflation with data for September 2026 is scheduled for 2 October 2026.
Methods and definitions
Annual inflation is the price change of consumer goods and services between the current month and the same month of the previous year. Monthly inflation is the price change between the current month and the previous month.
A contribution shows how much of the annual inflation rate comes from a particular component of the HICP. The contributions are calculated according to a method which ensures their additivity (allowing for rounding).
Geographical information
Up to December 31, 2025, the euro area included Belgium, Germany, Estonia, Ireland, Greece, Spain, France, Croatia, Italy, Cyprus, Latvia, Lithuania, Luxembourg, Malta, the Netherlands, Austria, Portugal, Slovenia, Slovakia and Finland (EA20). From 1 January 2026, the euro area also includes Bulgaria (EA21).
The European Union includes Belgium, Bulgaria, Czechia, Denmark, Germany, Estonia, Ireland, Greece, Spain, France, Croatia, Italy, Cyprus, Latvia, Lithuania, Luxembourg, Hungary, Malta, the Netherlands, Austria, Poland, Portugal, Romania, Slovenia, Slovakia, Finland and Sweden (EU27).
The aggregate data series published in this Euro indicator release refer to the evolving composition of the euro area and the European Union. Thus, Euro indicator data for months up to December 2025 represent EA20 series, while Euro indicator data for January 2026 onwards represent EA21 series. Changes in the composition of the euro area are incorporated using a chain index formula.
For more information
Source: Eurostat, ec.europa.eu/eurostat. Documento original ↗