
Volume of retail trade up by 0.1% in both the euro area and the EU
Source: Eurostat, ec.europa.eu/eurostat. Reproduced unchanged under the Creative Commons Attribution 4.0 International licence. Original document ↗
Overview
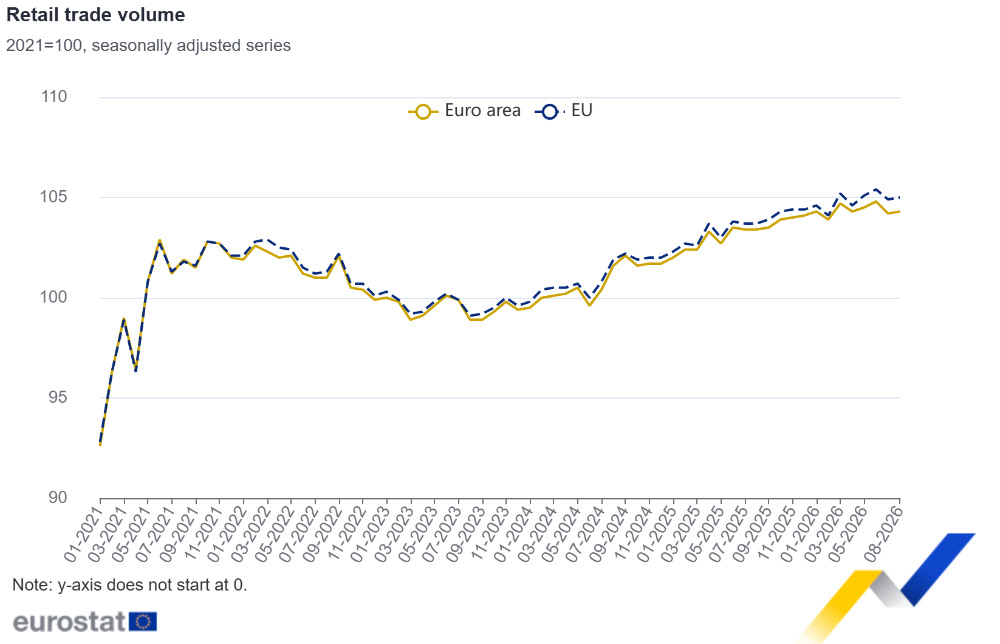
In August 2026, compared with July 2026, the seasonally adjusted retail trade volume increased by 0.1% in both the euro area and the EU, according to first estimates from Eurostat, the statistical office of the European Union. In July 2026, retail trade volume fell by 0.6% in the euro area and by 0.5% in the EU.
In August 2026, compared with August 2025, the calendar adjusted retail sales index increased by 0.8% in the euro area and by 1.2% in the EU.
Monthly comparison by retail sector and by Member State
In the euro area in August 2026, compared with July 2026, the volume of retail trade
increased for food, drinks, tobacco by 0.1%,
increased for non-food products (except automotive fuel) by 0.5%,
decreased for automotive fuel in specialised stores by 1.9%.
In the EU, the volume of retail trade
increased for food, drinks, tobacco by 0.3%,
increased for non-food products (except automotive fuel) by 0.5%,
decreased for automotive fuel in specialised stores by 1.3%.
Among Member States for which data are available, the highest monthly increases in the total retail trade volume were recorded in Romania (+2.3%), Sweden (+1.4%) and Germany (+1.3%). The largest decreases were observed in Luxembourg (-9.4%), Malta (-1.9%) and Latvia (-1.4%).
Annual comparison by retail sector and by Member State
In the euro area in August 2026, compared with August 2025, the volume of retail trade
increased for food, drinks, tobacco by 1.6%,
increased for non-food products (except automotive fuel) by 1.7%,
decreased for automotive fuel in specialised stores by 3.7%.
In the EU, the volume of retail trade
increased for food, drinks, tobacco by 1.4%,
increased for non-food products (except automotive fuel) by 2.2%,
decreased for automotive fuel in specialised stores by 1.9%.
Among Member States for which data are available, the highest annual increases in the total retail trade volume were recorded in Sweden (+7.7%), Cyprus (+7.5%) and Estonia (+6.0%). Decreases were observed in Malta (-2.4%), Spain (-0.6%), Italy (-0.5%) and Germany (-0.4%).
Tables
Volume of retail trade % change compared with the previous month* |
||||||
|---|---|---|---|---|---|---|
Mar-26 |
Apr-26 |
May-26 |
Jun-26 |
Jul-26 |
Aug-26 |
|
Euro area |
||||||
Total retail trade |
0.8 |
-0.4 |
0.2 |
0.3 |
-0.6 |
0.1 |
Food, drinks, tobacco |
-0.1 |
0.7 |
0.3 |
-0.5 |
-0.1 |
0.1 |
Non-food products (except automotive fuel) |
1.5 |
-0.6 |
0.5 |
0.6 |
-1.2 |
0.5 |
Automotive fuel in specialised stores |
1.0 |
-3.4 |
-1.6 |
1.9 |
-0.2 |
-1.9 |
EU |
||||||
Total retail trade |
1.1 |
-0.6 |
0.5 |
0.3 |
-0.5 |
0.1 |
Food, drinks, tobacco |
0.1 |
0.6 |
0.3 |
-0.5 |
-0.1 |
0.3 |
Non-food products (except automotive fuel) |
1.8 |
-0.9 |
0.7 |
0.5 |
-0.9 |
0.5 |
Automotive fuel in specialised stores |
1.7 |
-3.1 |
-1.3 |
1.7 |
-0.7 |
-1.3 |
* Calendar and seasonally adjusted Source dataset: sts_trtu_m
|
||||||

Volume of retail trade % change compared with the previous month* |
||||||
|---|---|---|---|---|---|---|
Mar-26 |
Apr-26 |
May-26 |
Jun-26 |
Jul-26 |
Aug-26 |
|
Euro area |
0.8 |
-0.4 |
0.2 |
0.3 |
-0.6 |
0.1 |
EU |
1.1 |
-0.6 |
0.5 |
0.3 |
-0.5 |
0.1 |
Belgium |
3.6 |
-1.8 |
-0.7 |
0.8 |
0.9 |
-0.2 |
Bulgaria |
1.3 |
-1.0 |
0.7 |
0.4 |
-0.3 |
0.3 |
Czechia |
1.6 |
-1.1 |
1.3 |
-0.2 |
0.6 |
c |
Denmark |
4.1 |
-5.1 |
3.6 |
0.1 |
0.5 |
-0.3 |
Germany |
0.1 |
-0.5 |
1.0 |
0.2 |
-3.2 |
1.3 |
Estonia |
0.1 |
-1.4 |
-2.3 |
1.1 |
0.8 |
0.9 |
Ireland |
0.7 |
-0.8 |
0.6 |
0.6 |
0.7 |
0.2 |
Greece |
-0.4 |
-1.5 |
3.3 |
-1.5 |
1.4 |
c |
Spain |
1.1 |
-1.6 |
0.6 |
0.3 |
-1.0 |
0.3 |
France |
0.7 |
0.6 |
-0.2 |
0.5 |
0.8 |
-1.1 |
Croatia |
0.5 |
-0.3 |
-0.7 |
0.9 |
0.4 |
0.5 |
Italy |
0.4 |
-0.1 |
-0.4 |
0.2 |
-0.4 |
0.1 |
Cyprus |
0.6 |
-0.9 |
3.7 |
-0.9 |
2.0 |
0.2 |
Latvia |
-0.1 |
-0.3 |
0.2 |
0.7 |
2.1 |
-1.4 |
Lithuania |
3.6 |
2.4 |
-1.0 |
0.5 |
0.5 |
0.2 |
Luxembourg |
1.7 |
-6.2 |
-4.7 |
4.0 |
3.8 |
-9.4 |
Hungary |
1.8 |
-1.3 |
0.7 |
-0.4 |
0.9 |
-0.7 |
Malta |
-1.6 |
0.9 |
0.1 |
0.2 |
0.6 |
-1.9 |
Netherlands |
1.4 |
-0.4 |
0.1 |
0.2 |
-0.2 |
0.7 |
Austria |
0.2 |
0.1 |
0.2 |
-0.1 |
0.6 |
-0.9 |
Poland |
2.9 |
-1.1 |
2.0 |
0.6 |
-0.3 |
-0.7 |
Portugal |
2.6 |
-0.6 |
-0.3 |
1.0 |
-0.1 |
-0.7 |
Romania |
2.0 |
-2.5 |
0.8 |
-1.3 |
0.7 |
2.3 |
Slovenia |
5.3 |
-1.0 |
0.2 |
-0.5 |
1.4 |
1.1 |
Slovakia |
2.5 |
-1.8 |
0.0 |
0.4 |
0.3 |
0.9 |
Finland |
1.3 |
-0.2 |
0.4 |
-1.4 |
0.5 |
0.7 |
Sweden |
3.6 |
0.1 |
-0.3 |
1.5 |
0.4 |
1.4 |
Norway |
-0.2 |
0.2 |
-2.2 |
1.6 |
-0.6 |
0.6 |
Switzerland |
0.6 |
0.2 |
0.7 |
0.4 |
0.2 |
0.4 |
* Calendar and seasonally adjusted c Confidential Source dataset: sts_trtu_m
|
||||||
Volume of retail trade % change compared with the same month of the previous year* |
||||||
|---|---|---|---|---|---|---|
Mar-26 |
Apr-26 |
May-26 |
Jun-26 |
Jul-26 |
Aug-26 |
|
Euro area |
||||||
Total retail trade |
2.4 |
1.0 |
1.9 |
1.4 |
0.4 |
0.8 |
Food, drinks, tobacco |
1.0 |
1.1 |
2.1 |
0.7 |
1.2 |
1.6 |
Non-food products (except automotive fuel) |
3.9 |
1.9 |
2.9 |
2.9 |
0.4 |
1.7 |
Automotive fuel in specialised stores |
1.3 |
-4.8 |
-5.6 |
-4.1 |
-2.9 |
-3.7 |
EU |
||||||
Total retail trade |
3.0 |
0.8 |
2.0 |
1.7 |
0.9 |
1.2 |
Food, drinks, tobacco |
0.9 |
0.7 |
1.7 |
0.5 |
1.0 |
1.4 |
Non-food products (except automotive fuel) |
4.4 |
1.5 |
3.3 |
3.1 |
1.0 |
2.2 |
Automotive fuel in specialised stores |
3.2 |
-3.1 |
-3.8 |
-2.7 |
-1.8 |
-1.9 |
* Calendar adjusted Source dataset: sts_trtu_m
|
||||||
Volume of retail trade % change compared with the same month of the previous year* |
||||||
|---|---|---|---|---|---|---|
Mar-26 |
Apr-26 |
May-26 |
Jun-26 |
Jul-26 |
Aug-26 |
|
Euro area |
2.4 |
1.0 |
1.9 |
1.4 |
0.4 |
0.8 |
EU |
3.0 |
0.8 |
2.0 |
1.7 |
0.9 |
1.2 |
Belgium |
1.9 |
-2.1 |
-0.4 |
-0.1 |
0.6 |
0.0 |
Bulgaria |
12.4 |
7.4 |
7.9 |
7.1 |
5.6 |
5.9 |
Czechia |
6.2 |
0.8 |
4.8 |
3.4 |
4.8 |
c |
Denmark |
6.7 |
0.6 |
4.3 |
5.3 |
4.8 |
3.9 |
Germany |
1.0 |
-0.4 |
1.8 |
0.7 |
-2.2 |
-0.4 |
Estonia |
6.2 |
1.6 |
-0.5 |
0.2 |
4.1 |
6.0 |
Ireland |
1.1 |
0.4 |
0.7 |
0.8 |
2.8 |
3.1 |
Greece |
3.0 |
-0.3 |
6.7 |
1.8 |
5.2 |
c |
Spain |
4.3 |
0.3 |
1.2 |
0.8 |
-0.7 |
-0.6 |
France |
2.6 |
2.3 |
2.4 |
2.5 |
2.6 |
1.3 |
Croatia |
3.3 |
2.0 |
0.5 |
0.5 |
3.7 |
3.2 |
Italy |
2.2 |
0.8 |
0.7 |
0.8 |
-0.9 |
-0.5 |
Cyprus |
6.1 |
2.7 |
8.4 |
5.0 |
8.6 |
7.5 |
Latvia |
4.1 |
2.5 |
3.6 |
5.2 |
6.8 |
3.5 |
Lithuania |
6.7 |
9.8 |
6.9 |
6.5 |
6.0 |
3.8 |
Luxembourg |
8.6 |
4.7 |
0.9 |
7.0 |
1.5 |
0.9 |
Hungary |
8.2 |
3.6 |
4.8 |
3.0 |
4.9 |
2.4 |
Malta |
3.2 |
6.8 |
5.1 |
4.9 |
6.7 |
-2.4 |
Netherlands |
1.6 |
1.4 |
1.7 |
1.5 |
0.8 |
1.9 |
Austria |
0.1 |
-0.3 |
0.7 |
0.3 |
1.3 |
0.2 |
Poland |
7.1 |
-1.0 |
3.3 |
4.5 |
3.6 |
2.4 |
Portugal |
6.2 |
5.2 |
2.6 |
2.4 |
2.6 |
2.2 |
Romania |
-2.6 |
-5.8 |
-4.4 |
-6.9 |
-6.4 |
1.2 |
Slovenia |
6.2 |
3.0 |
2.2 |
1.6 |
4.9 |
5.6 |
Slovakia |
5.2 |
-0.2 |
1.5 |
1.4 |
0.1 |
2.0 |
Finland |
4.0 |
2.2 |
5.4 |
2.4 |
2.0 |
3.8 |
Sweden |
6.2 |
4.7 |
7.9 |
7.0 |
6.7 |
7.7 |
Norway |
0.9 |
0.8 |
-2.4 |
-0.5 |
-2.0 |
-1.0 |
Switzerland |
1.5 |
1.7 |
3.6 |
2.1 |
2.6 |
3.1 |
* Calendar adjusted c Confidential Source dataset: sts_trtu_m
|
||||||
Volume of retail trade, calendar and seasonally adjusted indices (base year 2021) |
||||||
|---|---|---|---|---|---|---|
Mar-26 |
Apr-26 |
May-26 |
Jun-26 |
Jul-26 |
Aug-26 |
|
Euro area |
104.7 |
104.3 |
104.5 |
104.8 |
104.2 |
104.3 |
EU |
105.2 |
104.6 |
105.1 |
105.4 |
104.9 |
105.0 |
Belgium |
95.1 |
93.4 |
92.7 |
93.4 |
94.2 |
94.0 |
Bulgaria |
128.9 |
127.6 |
128.5 |
129.0 |
128.6 |
129.0 |
Czechia |
103.1 |
102.0 |
103.3 |
103.1 |
103.7 |
c |
Denmark |
102.5 |
97.3 |
100.8 |
100.9 |
101.4 |
101.1 |
Germany |
101.2 |
100.7 |
101.7 |
101.9 |
98.6 |
99.9 |
Estonia |
97.3 |
95.9 |
93.7 |
94.7 |
95.5 |
96.4 |
Ireland |
111.6 |
110.7 |
111.4 |
112.1 |
112.9 |
113.1 |
Greece |
103.4 |
101.8 |
105.2 |
103.6 |
105.0 |
c |
Spain |
113.2 |
111.4 |
112.1 |
112.4 |
111.3 |
111.6 |
France |
108.0 |
108.6 |
108.4 |
108.9 |
109.8 |
108.6 |
Croatia |
118.7 |
118.4 |
117.6 |
118.7 |
119.2 |
119.8 |
Italy |
98.2 |
98.1 |
97.7 |
97.9 |
97.5 |
97.6 |
Cyprus |
129.3 |
128.2 |
133.0 |
131.8 |
134.4 |
134.7 |
Latvia |
106.8 |
106.5 |
106.7 |
107.5 |
109.8 |
108.3 |
Lithuania |
112.3 |
115.0 |
113.9 |
114.5 |
115.1 |
115.3 |
Luxembourg |
146.3 |
137.2 |
130.7 |
135.9 |
141.1 |
127.9 |
Hungary |
107.1 |
105.7 |
106.4 |
106.0 |
107.0 |
106.3 |
Malta |
127.1 |
128.2 |
128.3 |
128.6 |
129.4 |
126.9 |
Netherlands |
102.9 |
102.5 |
102.6 |
102.8 |
102.6 |
103.3 |
Austria |
97.3 |
97.4 |
97.6 |
97.5 |
98.1 |
97.2 |
Poland |
112.9 |
111.7 |
113.9 |
114.6 |
114.2 |
113.4 |
Portugal |
119.8 |
119.1 |
118.8 |
120.0 |
119.9 |
119.1 |
Romania |
113.6 |
110.8 |
111.7 |
110.3 |
111.1 |
113.7 |
Slovenia |
104.4 |
103.4 |
103.6 |
103.1 |
104.5 |
105.6 |
Slovakia |
104.4 |
102.5 |
102.5 |
102.9 |
103.2 |
104.1 |
Finland |
94.8 |
94.6 |
95.0 |
93.7 |
94.2 |
94.9 |
Sweden |
100.9 |
101.0 |
100.7 |
102.2 |
102.6 |
104.0 |
Norway |
95.9 |
96.1 |
94.0 |
95.5 |
94.9 |
95.5 |
Switzerland |
102.1 |
102.3 |
103.0 |
103.4 |
103.6 |
104.0 |
c Confidential Source dataset: sts_trtu_m
|
||||||
Volume of retail trade, calendar adjusted indices (base year 2021) |
||||||
|---|---|---|---|---|---|---|
Mar-26 |
Apr-26 |
May-26 |
Jun-26 |
Jul-26 |
Aug-26 |
|
Euro area |
103.4 |
100.9 |
104.3 |
105.4 |
102.5 |
107.1 |
EU |
104.3 |
101.6 |
105.1 |
106.0 |
103.7 |
107.6 |
Belgium |
94.9 |
91.6 |
94.3 |
96.5 |
94.8 |
88.4 |
Bulgaria |
126.6 |
122.3 |
126.1 |
129.0 |
134.6 |
132.9 |
Czechia |
102.1 |
97.0 |
103.3 |
103.4 |
101.3 |
c |
Denmark |
99.7 |
97.3 |
107.0 |
103.9 |
99.9 |
102.3 |
Germany |
104.4 |
101.1 |
102.7 |
101.0 |
99.1 |
96.0 |
Estonia |
97.6 |
94.1 |
95.3 |
96.2 |
98.4 |
98.3 |
Ireland |
102.6 |
101.6 |
108.2 |
118.0 |
104.4 |
106.7 |
Greece |
98.9 |
99.0 |
104.5 |
105.9 |
111.5 |
c |
Spain |
109.6 |
105.8 |
110.6 |
115.2 |
119.4 |
110.7 |
France |
105.6 |
105.4 |
106.4 |
108.7 |
90.1 |
127.4 |
Croatia |
109.9 |
114.2 |
117.0 |
127.9 |
146.4 |
144.0 |
Italy |
94.5 |
89.0 |
97.5 |
98.3 |
104.6 |
95.3 |
Cyprus |
122.6 |
122.1 |
131.1 |
133.3 |
143.4 |
135.5 |
Latvia |
104.1 |
101.4 |
106.1 |
108.9 |
116.6 |
116.3 |
Lithuania |
109.2 |
114.5 |
117.9 |
116.7 |
119.9 |
121.1 |
Luxembourg |
150.9 |
137.1 |
133.8 |
144.4 |
151.2 |
124.9 |
Hungary |
107.2 |
104.4 |
106.6 |
107.0 |
109.5 |
108.6 |
Malta |
118.8 |
122.5 |
130.7 |
134.2 |
143.2 |
128.1 |
Netherlands |
103.1 |
101.0 |
106.5 |
105.0 |
105.2 |
99.0 |
Austria |
98.8 |
98.5 |
96.2 |
97.8 |
100.1 |
95.1 |
Poland |
118.2 |
111.2 |
113.5 |
113.6 |
115.3 |
114.6 |
Portugal |
113.6 |
111.1 |
117.2 |
116.0 |
128.6 |
127.0 |
Romania |
110.6 |
109.8 |
111.5 |
110.4 |
116.5 |
119.5 |
Slovenia |
107.2 |
103.1 |
103.4 |
105.2 |
108.0 |
106.7 |
Slovakia |
105.8 |
100.6 |
103.5 |
104.4 |
102.4 |
102.7 |
Finland |
91.5 |
92.6 |
99.5 |
99.1 |
100.4 |
99.3 |
Sweden |
99.1 |
100.7 |
106.4 |
108.2 |
105.5 |
106.5 |
Norway |
91.5 |
92.1 |
100.3 |
101.2 |
94.1 |
98.1 |
Switzerland |
102.8 |
98.2 |
104.8 |
103.3 |
102.9 |
98.4 |
c Confidential Source dataset: sts_trtu_m
|
||||||
Notes for users
Revisions and timetable
Compared with the data issued in the News Release of 4 September 2026, the monthly percentage decrease for July 2026 remained unchanged at -0.6% in the euro area and has been revised from -0.4% to -0.5% in the EU. The annual percentage increase has been revised from +0.6% to +0.4% in the euro area and from +1.0% to +0.9% in the EU.
Methods and definitions
The index of the volume of retail trade measures the evolution of the turnover in retail trade, adjusted for price changes (deflated), i.e. the evolution of the total amount of goods sold, based on data adjusted for calendar and seasonal effects.
Seasonally adjusted euro area and EU series are calculated by aggregating the seasonally adjusted national data.
Geographical information
Euro area (EA21): Belgium, Bulgaria, Germany, Estonia, Ireland, Greece, Spain, France, Croatia, Italy, Cyprus, Latvia, Lithuania, Luxembourg, Malta, the Netherlands, Austria, Portugal, Slovenia, Slovakia and Finland.
The European Union (EU27) includes Belgium, Bulgaria, Czechia, Denmark, Germany, Estonia, Ireland, Greece, Spain, France, Croatia, Italy, Cyprus, Latvia, Lithuania, Luxembourg, Hungary, Malta, the Netherlands, Austria, Poland, Portugal, Romania, Slovenia, Slovakia, Finland and Sweden.
For more information
Statistics Explained article on short-term business statistics revisions
The weights of the Member States in the EU and euro area aggregates
(See file Base year 2021 weights - Euro indicators releases)
Source: Eurostat, ec.europa.eu/eurostat. Original document ↗