Every trade, explained after it closes.
This journal documents the strategy behind DARWIN XFX: what we saw, where we entered, why we exited, and what the Darwinex risk engine did with it. Nothing here is a recommendation; it is the record.
4 years on Darwinex Our performance →
Latest from the journal
-
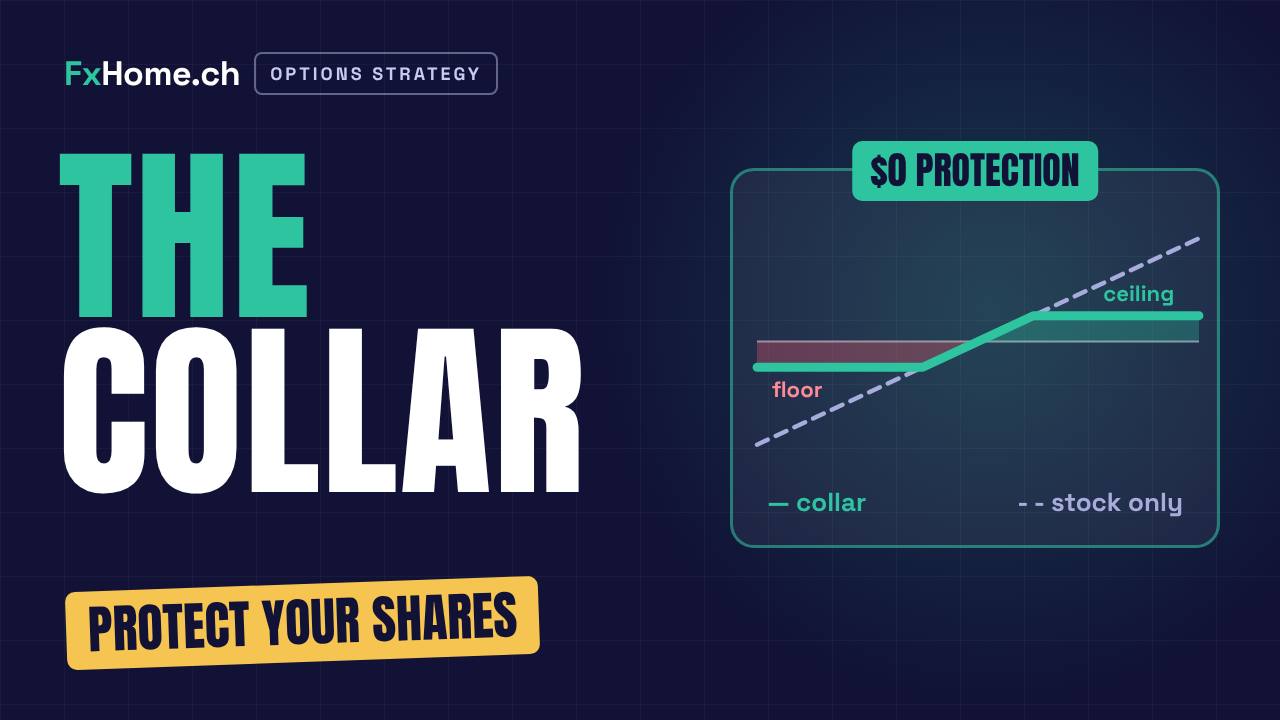
The Collar Strategy Explained: Protect Your Shares for (Almost) Free
How a collar protects a stock you own: buy a put below the price for a floor, sell a call above it for a ceiling, and let the call pay for the put. A full zero-cost example with max gain, max loss, breakeven, three outcomes at expiration, three ways to tune the strikes and how to manage the position
-
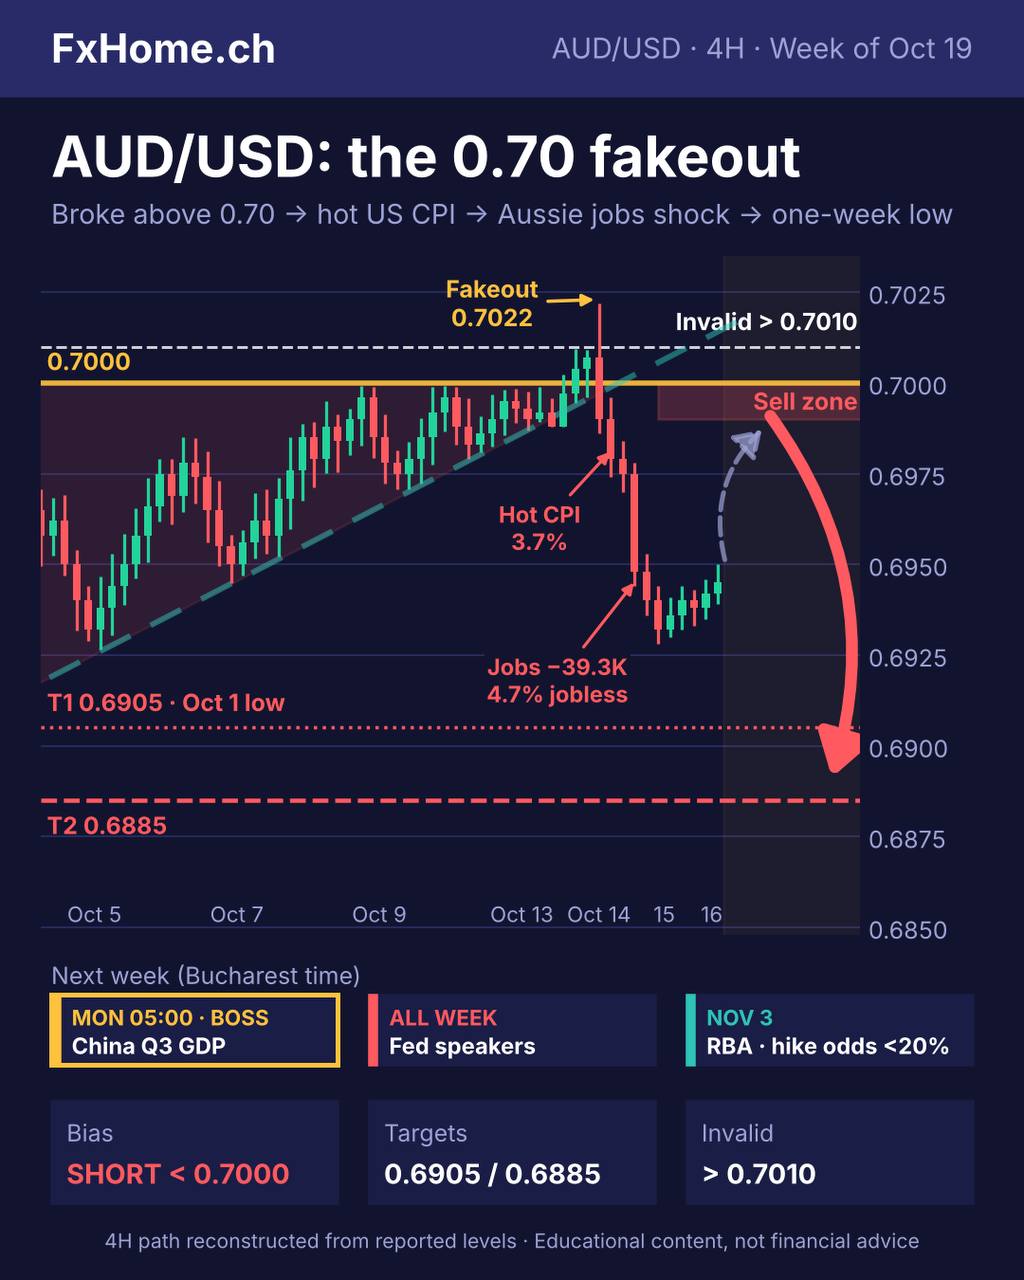
AUD/USD: The 0.70 Breakout Was a Fakeout. Two Punches, CPI and Jobs
AUD/USD broke above 0.70, then a hot US CPI and a shock Australian jobs report (−39.3K vs +19.6K expected, unemployment 4.7%) pushed it to a three-month low. What the failed breakout leaves on the chart, and the data that matter next week: China Q3 GDP and the RBA on 3 November.
-
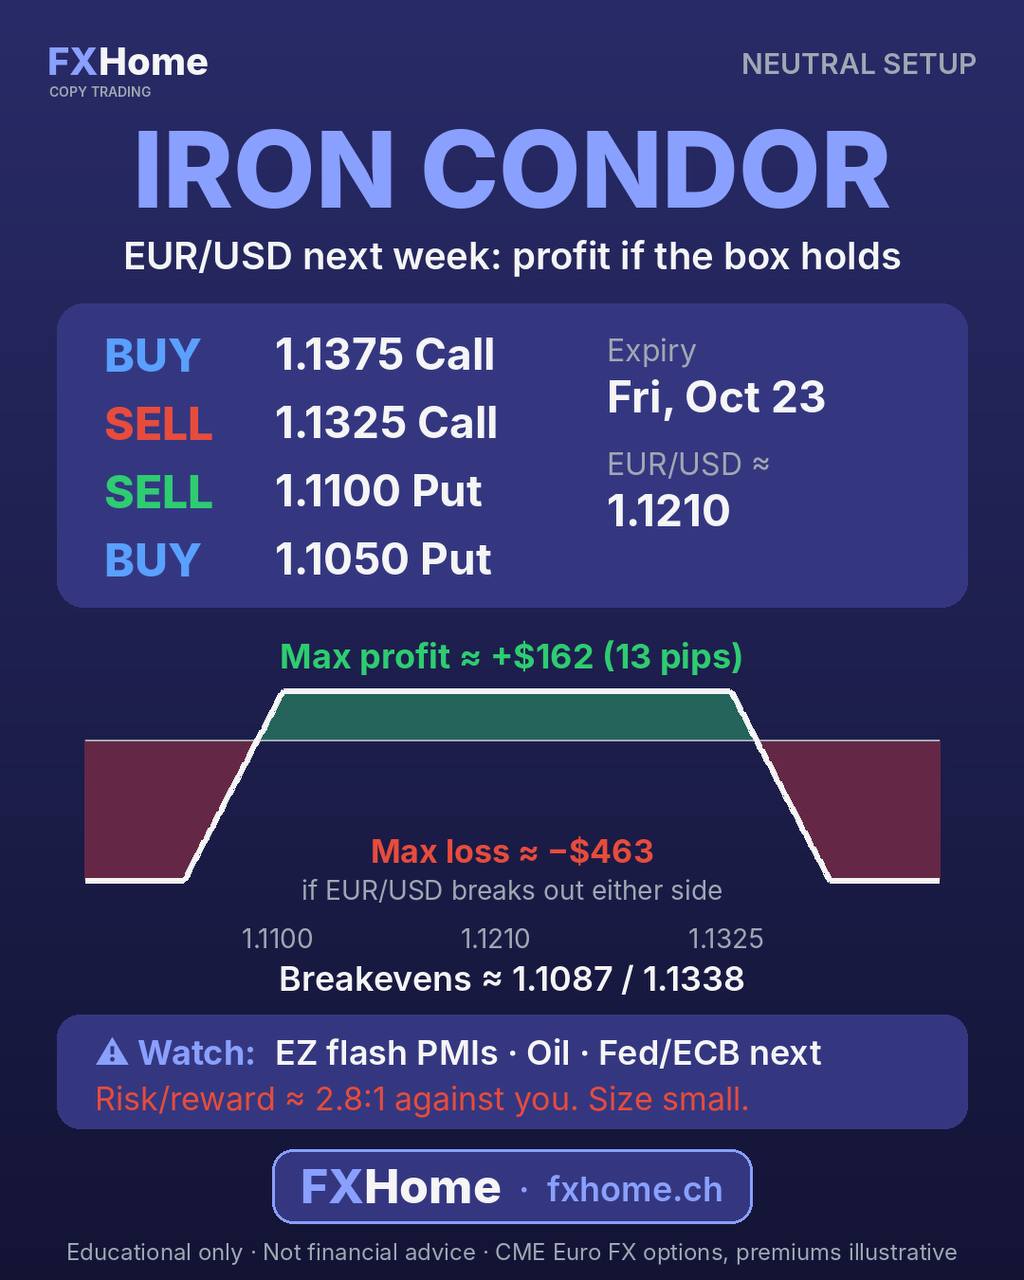
EUR/USD Stuck in a Box: An Iron Condor Example Before the Fed and ECB
EUR/USD has traded between about 1.1113 and 1.1285 since early October, and even a hot US CPI did not break the range. How an iron condor on CME Euro FX options (expiry 23 October) is built for a range, with its credit, maximum loss and breakevens worked out.
-
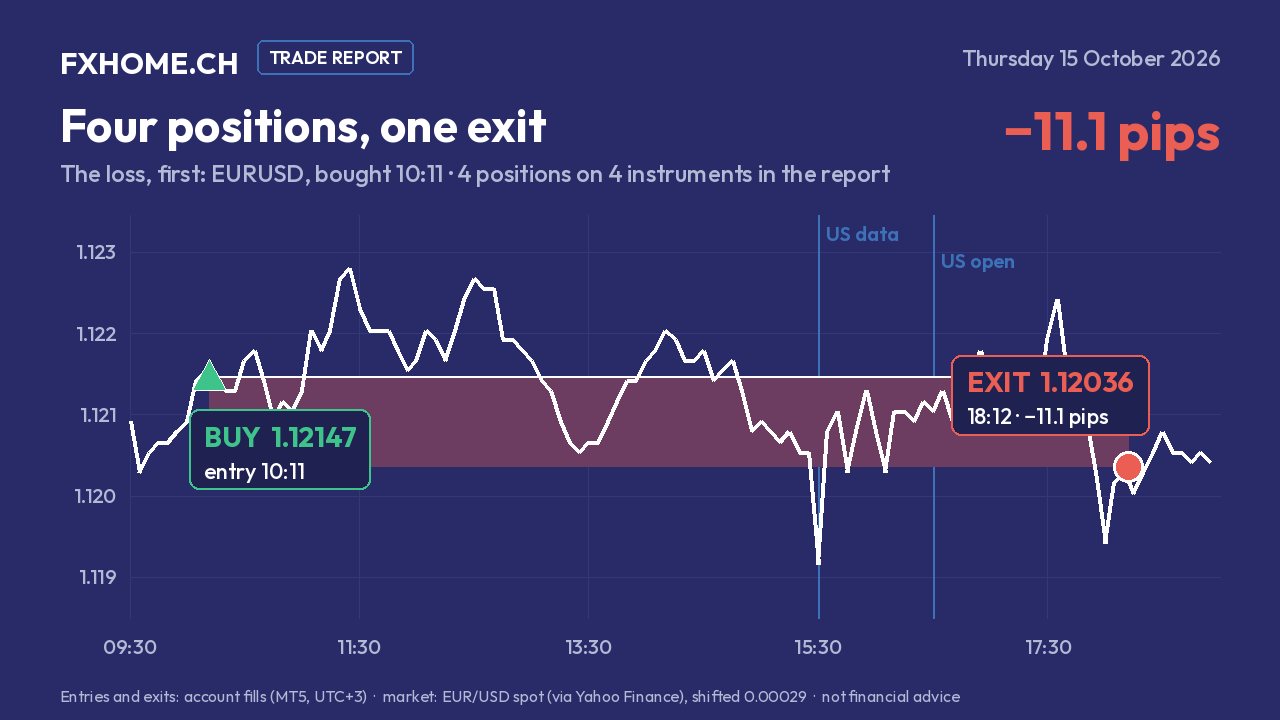
Trade report, 15 October 2026: four positions, one exit
Four long positions closed together at 18:12: EURUSD −11.1 pips and NDX −11.2 points first, then SP500 +25.0 points and GBPUSD +3.7 pips. Nothing held overnight; entry and exit charts for each instrument.
-
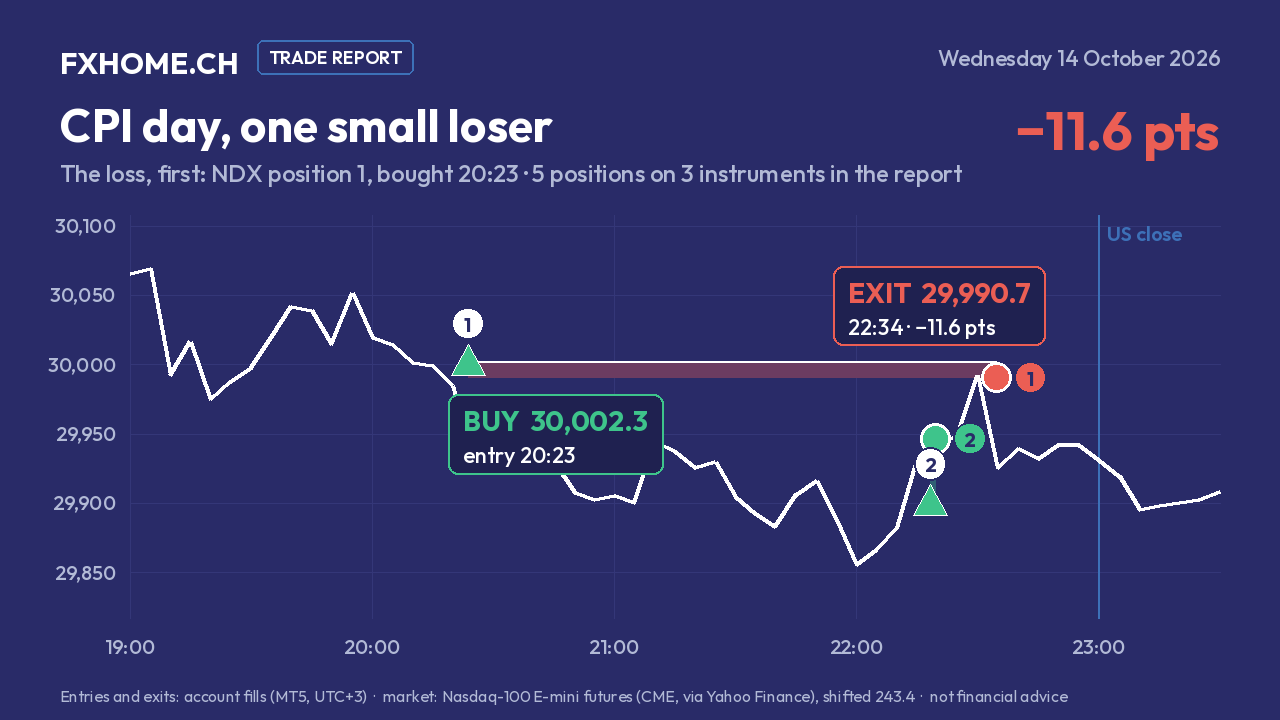
Trade report, 14 October 2026: CPI day, one small loser
Five long positions on US CPI day: NDX −11.6 points in the first SP500 and NDX basket, then NDX +45.4 and SP500 +5.0 in a second, SP500 +3.2, EURUSD +39.7 pips held overnight. The loss first, with entry and exit charts.
-
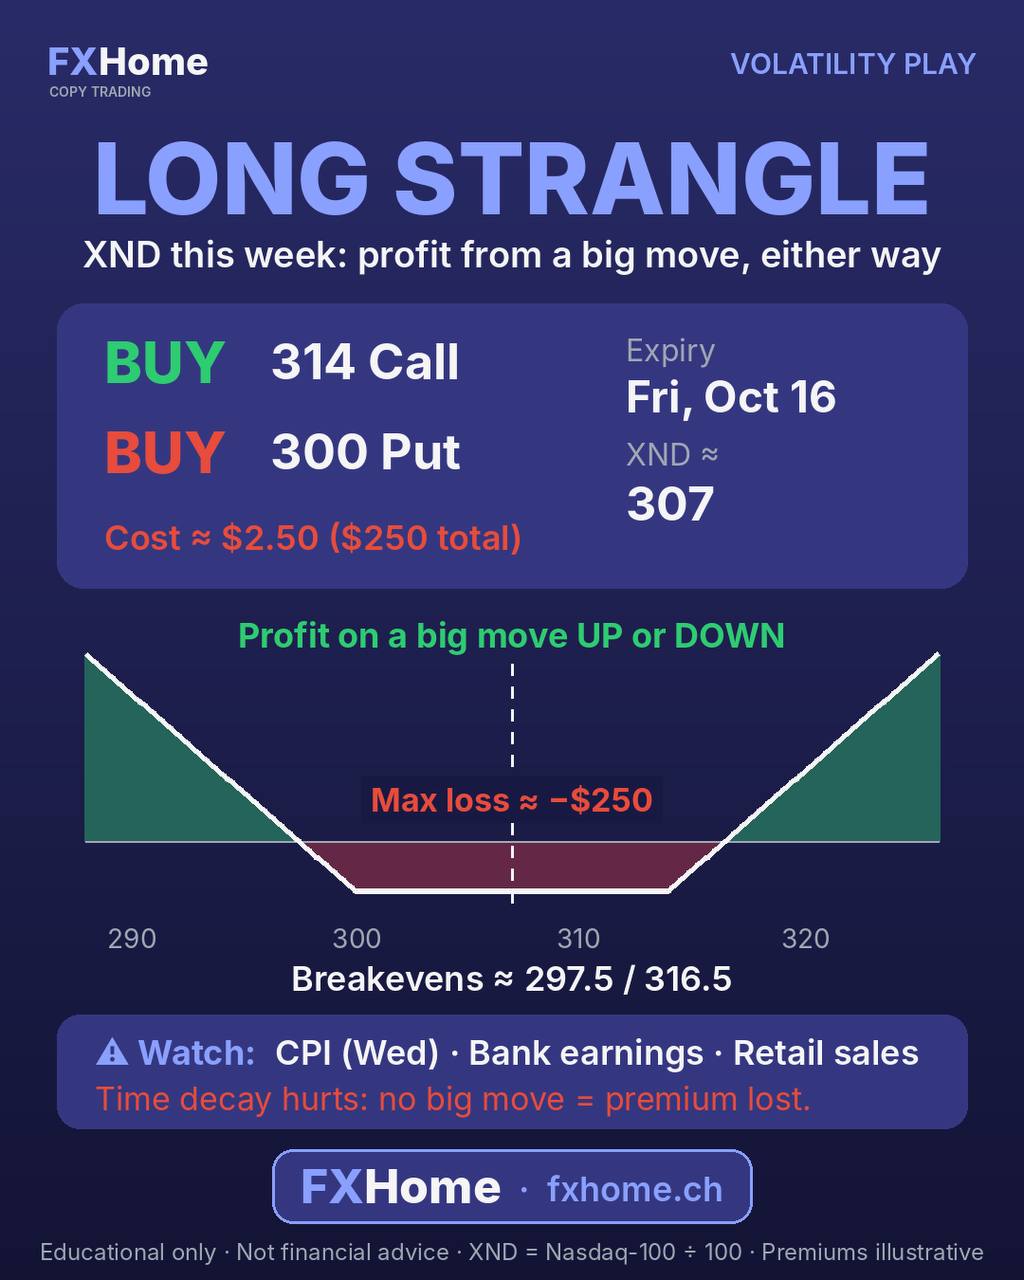
CPI Tomorrow: How to Trade a Big Nasdaq Move Without Picking a Direction
How a long strangle works around a big event like a CPI release: buy an out-of-the-money call and put, profit from a large move either way, and lose at most the premium if nothing happens. Worked example on Nasdaq-100 micro options (XND): 314 call + 300 put for about $250.
-
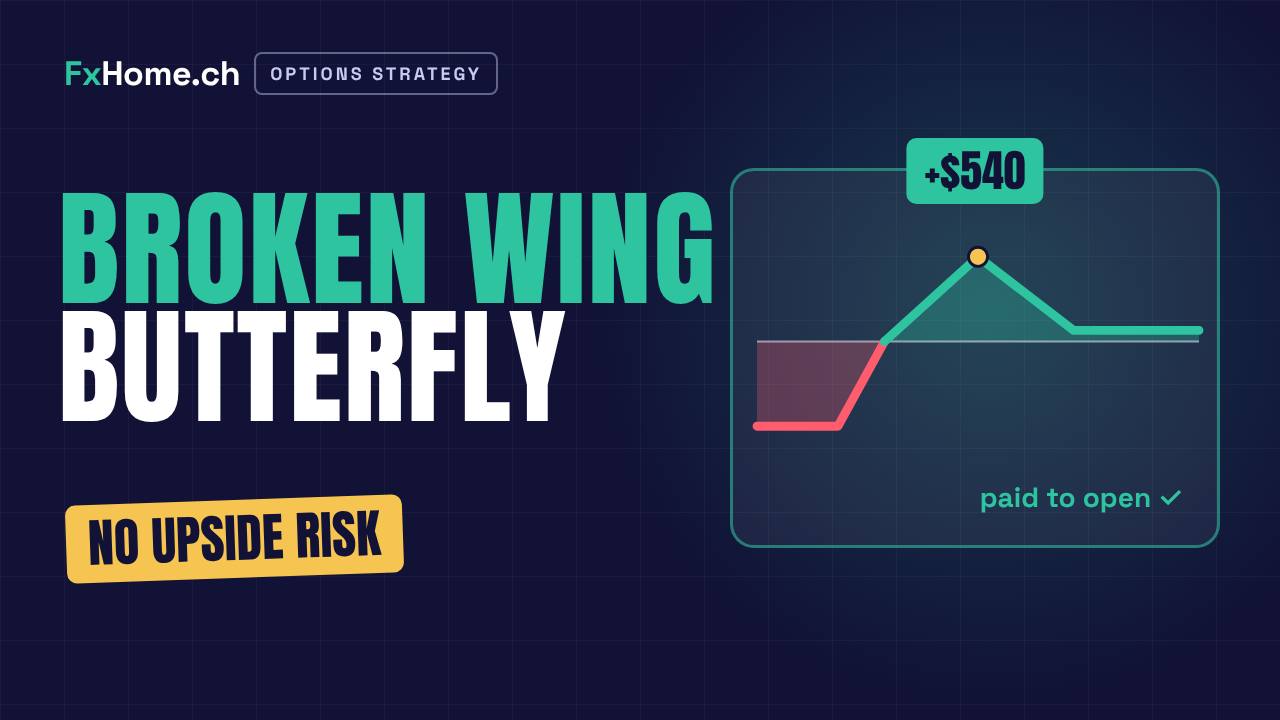
Broken Wing Butterfly Explained: No Upside Risk, Paid to Open
The broken wing butterfly explained step by step: one put spread wider than the other, opened for a net credit, so there is no risk above the upper strike. A worked XYZ example ($100) with max profit $540, breakeven $89.60, max loss $460 and three expiration scenarios.
-
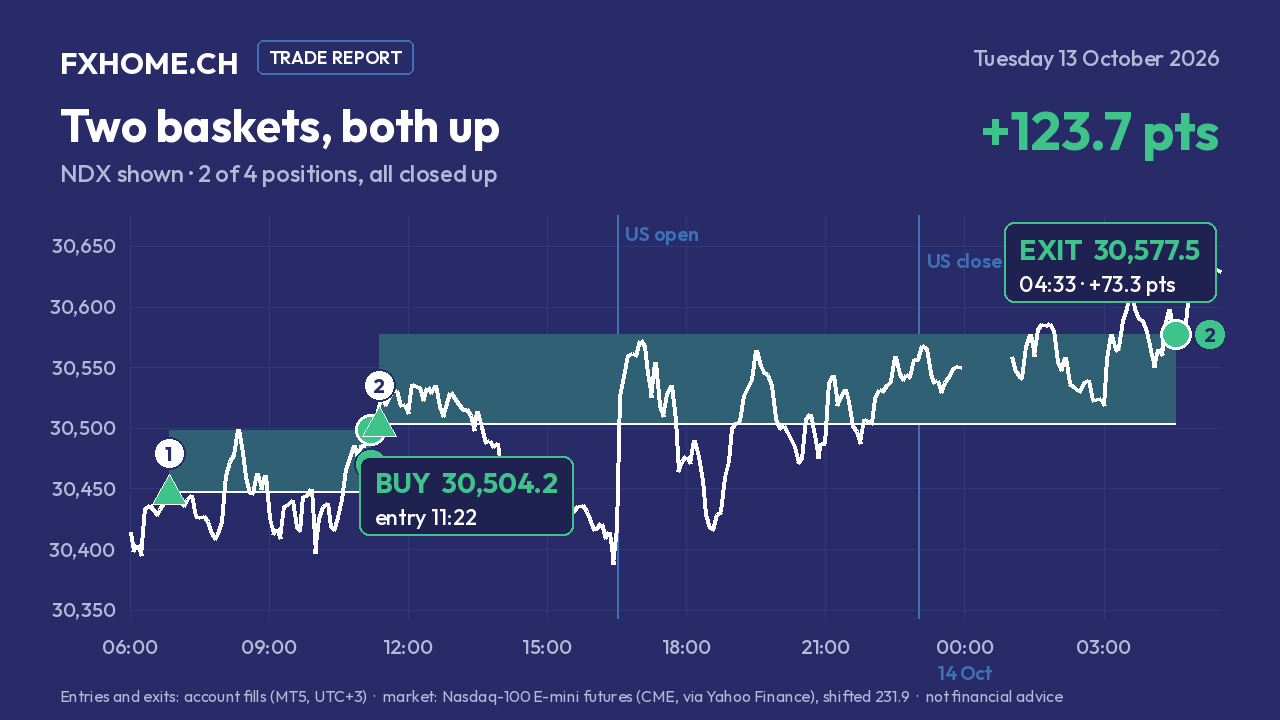
Trade report, 13 October 2026: two baskets, both up
Four long positions in two SP500 and NDX baskets, all closed up: NDX +50.4 and +73.3 points, SP500 +9.6 and +1.2 points. No loss; the smallest result first, with entry and exit charts.
-
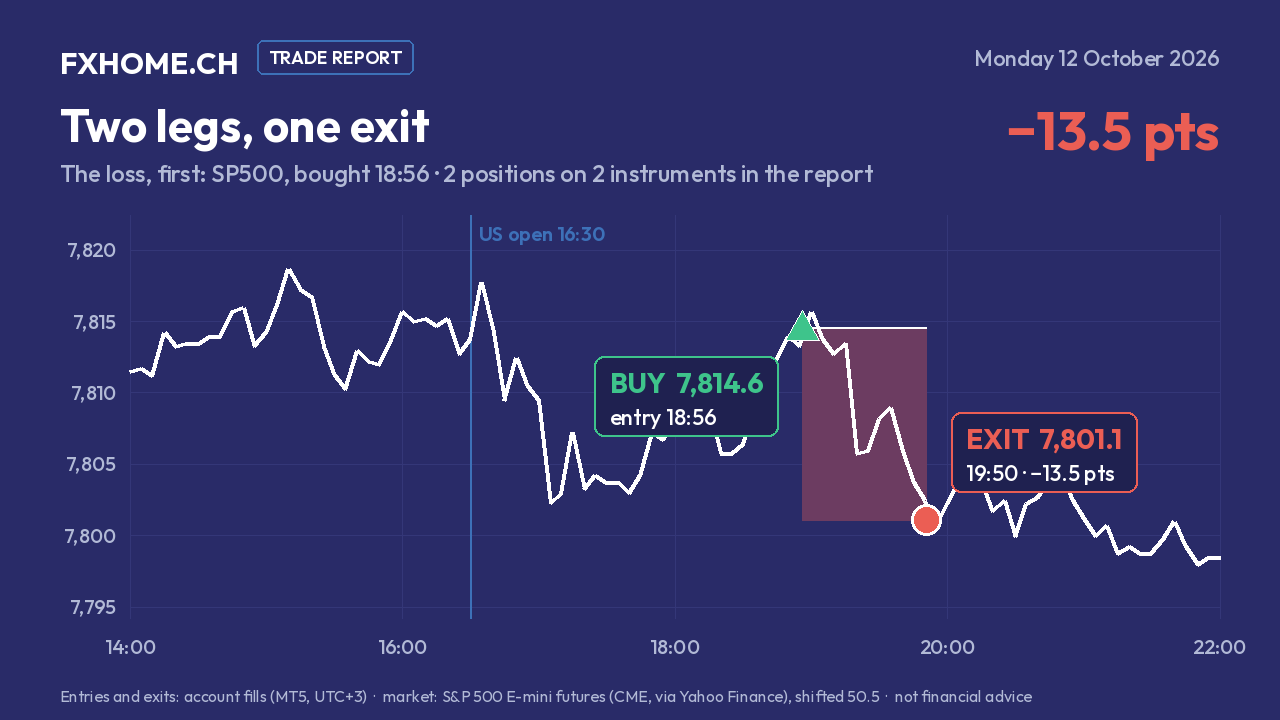
Trade report, 12 October 2026: two legs, one exit
One SP500 and NDX basket, bought together at 18:55 and closed together 55 minutes later: SP500 −13.5 points, NDX −74.0 points. Both legs closed down; the loss, first, with entry and exit charts.
-
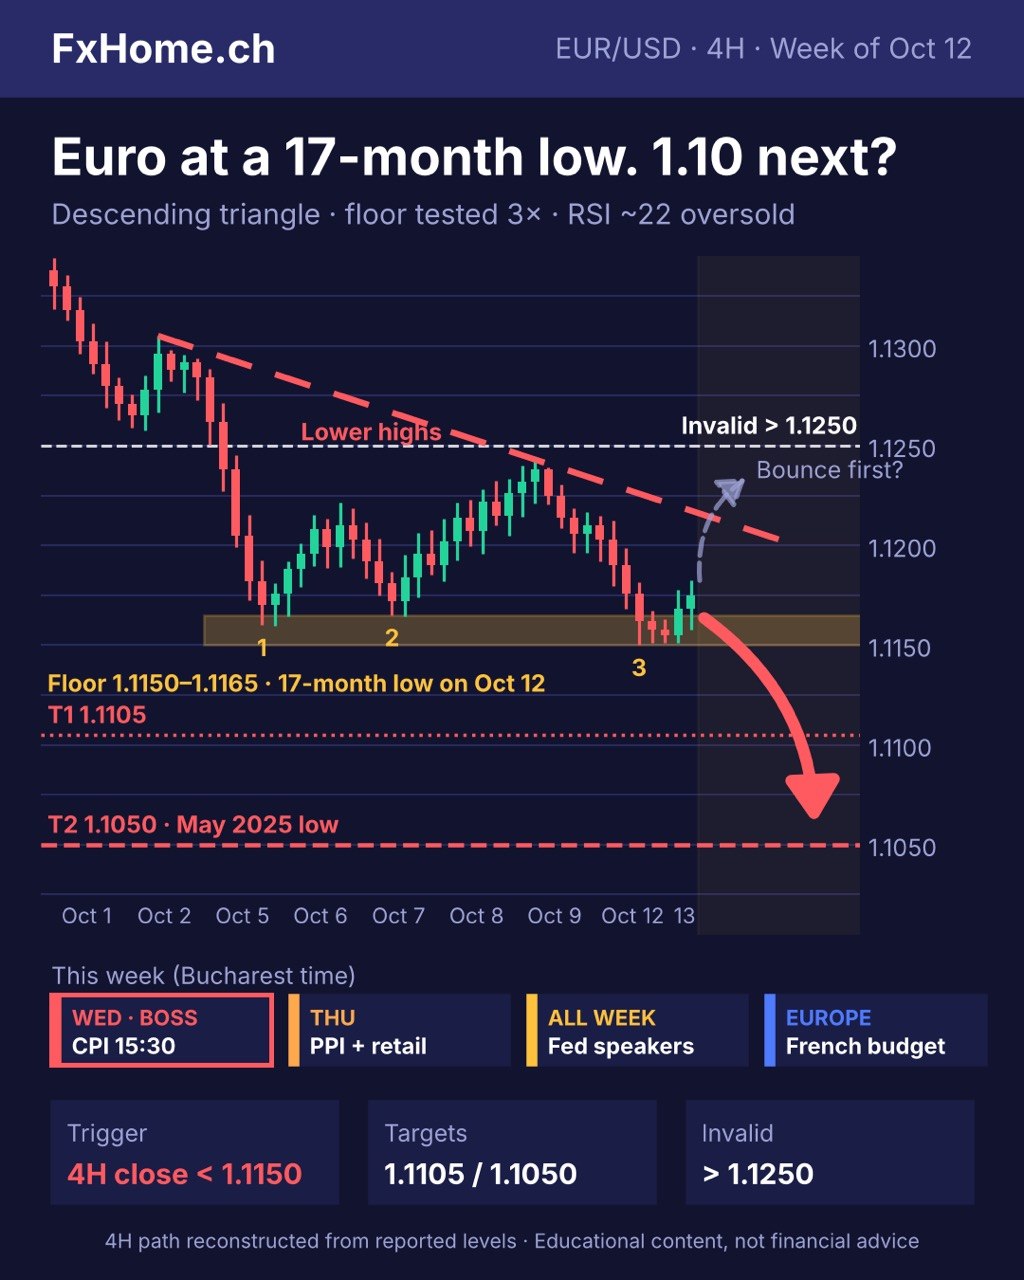
The Euro Just Hit a 17-Month Low 📉 Is 1.10 Next?
UR/USD fell to 1.1150 on Monday, its weakest level since May 2025, as a hawkish Fed, higher oil and French budget worries kept pressure on the euro. The 4H chart shows a descending triangle: lower highs pressing into a floor tested three times. A 4H close below 1.1150 opens 1.1105 and then 1.1050, a
-
Trade report, 9 October 2026: the rebound, one trade
One long SP500 position, held through the US open and closed 2 h 53 min before the cash close: +5.0 points, commission only, no loss. The quiet days are part of the record too.
-
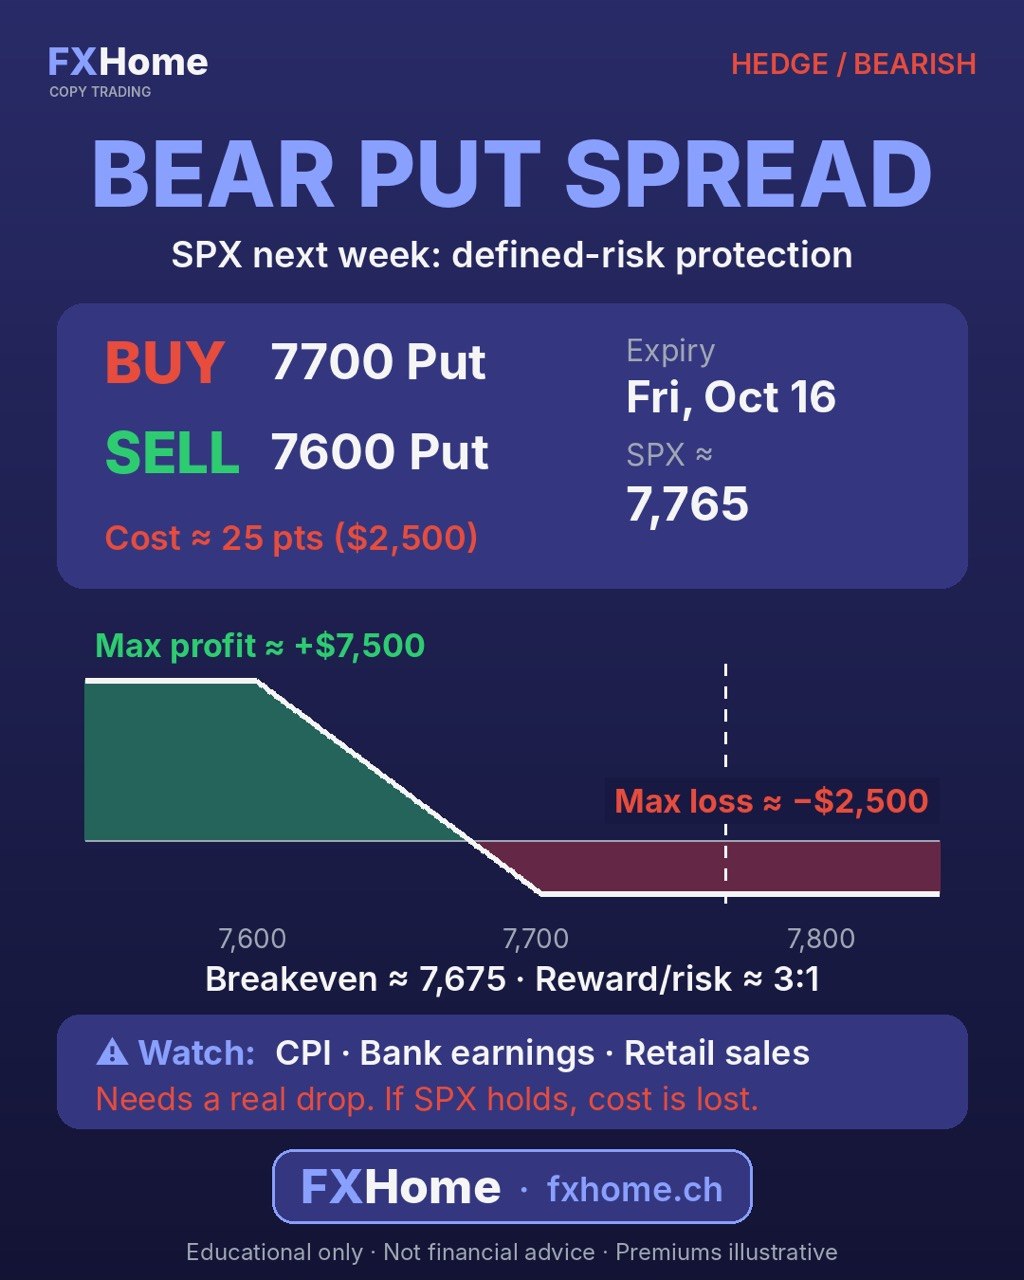
SPX Near Record Highs, But the Risks Are Piling Up: A Defined-Risk Hedge
The S&P 500 is sitting just under its record (~7,800), but the warning signs are growing: the 10-year yield is near 5.3%, oil is above $100, and CPI is out next week. Here's one way to protect against a pullback with a capped cost: the bear put spread.